Timelines Model (Version 5)
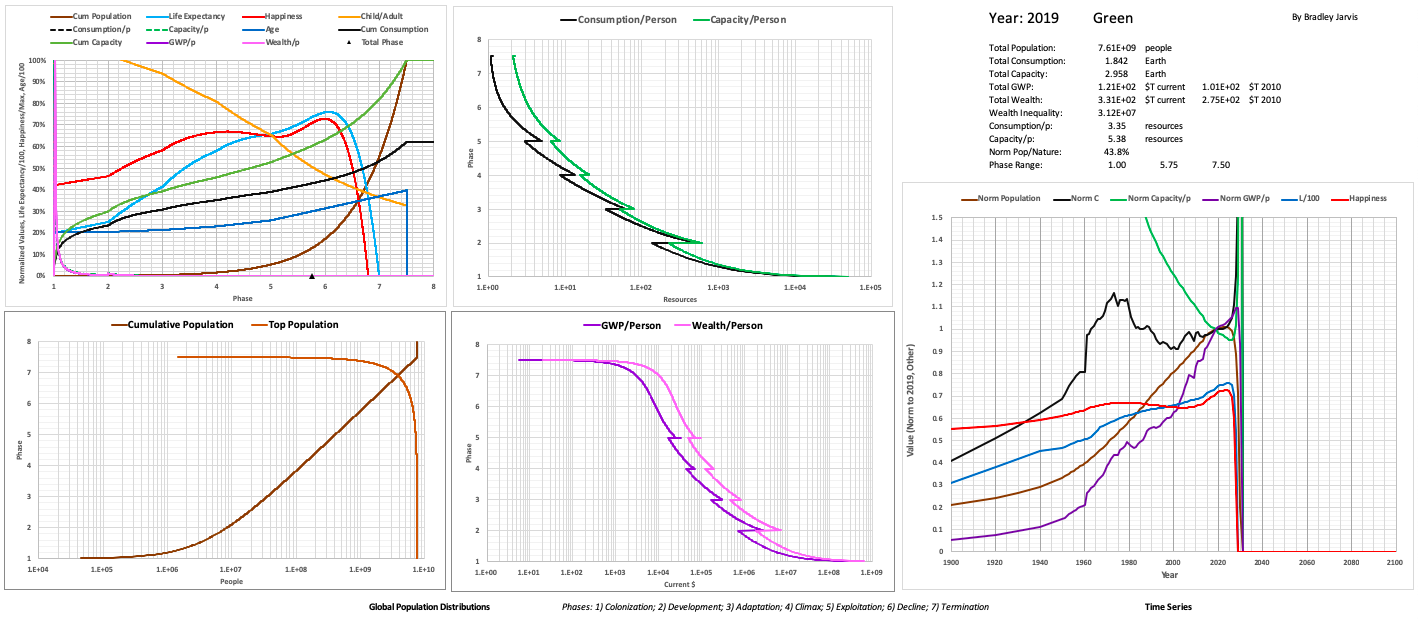
The following graph shows the relationships between global variables tracked in the Timelines model. Roll over to see the definitions as a function of phase.
.png)
Definitions of variables and terms used here and elsewhere are as follows. Variable names are capitalized, and references to other entries are italicized.
| adjusted impact | Amount of Impact after it has been changed by human activity (typically Consumption) |
| Age | Median age of a population, in years |
| Birth Rate | Births per year as a fraction of the population |
| C | Average Consumption per person in a group |
| Capacity | Total amount of ecological resources available to, and used by, a group (see Rtotal) |
| Cap/p | Capacity per person |
| C-low | Simulation that reduces consumption at a roughly constant rate to offset external Impact |
| Consumption | Ecological footprint of group expressed in ecological resources(see R) |
| cum, cumulative | Sum of values for a variable as a function of another variable |
| $ current | U.S. dollars inflation adjusted for a given year |
| Death Rate | Deaths per year as a fraction of the Population |
| ecological footprint | Measure of ecological products and services used by humanity, typically expressed as a unit of land area |
| ecological resource | Unit of ecological footprint corresponding to an average person's annual basic needs |
| Efficiency, E | Variable affecting the distribution of Population in a group |
| epoch | Period of time corresponding to when part of a group is in a given Phase. |
| global variable | A variable that describes a charcteristic of interest for one or more groups |
| Green | The simulation that is the best match to historical values of global variables |
| group | A set of people with specific Population, Consumption, and Capacity |
| GWP | Gross World Product in U.S. dollars (2010 value unless otherwise indicated) |
| GWP/p | Average GWP per person in U.S. dollars (2010 value unless otherwise indicated) |
| Happiness, H | Life satisfaction of members of a group (on a scale from 0 to 1, typically expressed in %) |
| Impact, self-sustained impact | Change in ecological resources (typically a reduction) continually caused by a non-human source |
| Life Expectancy, L | Expected lifetime (in years) of a person or group born in a given year |
| Max Phase | The maximum phase in a group |
| Min Phase | The minimum phase in a group |
| mixed group | A group resulting from interaction of groups based on maximum Weights of Population, C, and Capacity |
| Needs | Maximum ecological resources consumed for basic survival |
| Normalized | Expressed as a fraction of a given value (such as the maximum expected value or value in a given year) |
| Normalized Population / Nature | Sratio / 1.126; also: Sr |
| P | Cumulative population as a function of a variable such as phase (P = E^Phratio - E). |
| Phase | Activity type; each phase is expressed as a fraction of its Sr range |
| Phase Ratio, Phratio | Phratio = (Max Phase - Phase) / (Max Phase - Min Phase) |
| Pmax | Maximum world population as a function of Sratio |
| Population | The number of people in a group |
| R | Total amount of ecological resources consumed by a group (P * C) |
| Rdiff | Amount of total Wants consumed by a given group |
| region | An arbitrary collection of resources and people (also group) |
| resource | Ecological resource |
| Rs | Amount of ecological resources remaining in a region or the world, usable by people and other species |
| Rtotal | Capacity |
| $Convert | Global inflation of U.S. dollars, as multiple of a value in 2010 |
| simulation | Set of mathematical projections of observable variables (typically global variables) that define a universe |
| Sr | Normalized Population / Nature |
| Sratio | Ratio of minimum Consumption by people (Needs) to remaining resources (P / Rs) |
| state | The combined characteristics of an entity (such a group) based on the values of a set of global variables |
| summed group | A group with the sums of interacting groups' Population, Consumption, and Capacity |
| $T | Trillion U.S. dollars |
| total consumption | The Consumption of everyone in a group |
| universe, world | Theoretical reality defined by a simulation, based on history in the real world |
| variable | A mathematical quantity whose value is based on the values of other quantities |
| Wants | Resources consumed for purposes other than needs (R - Needs) |
| Waste | Consumption in excess of half the total resources in the world (R - Rtotal / 2) |
| Wealth | Wealth in U.S. dollars (2010 value unless otherwise indicated) |
| Wealth/p | Average wealth per person in U.S. dollars (2010 value unless otherwise indicated) |
| Weight | Multiplier of a variable used to calculate the value of another variable |
| weighted group | A group resulting from groups interacting based on Weights of Population, Consumption, and Capacity |
| world group | All the people and regions in the world identified as one group |
| Year | Middle of given calendar year (A.C.E.) |
See also:
- Simulated News blog (a fictional treatment of the model that includes "Reality Check" discussions of the underlying research)
- Idea Explorer blog (8/22/2019 and later)