Timelines Model (V4)
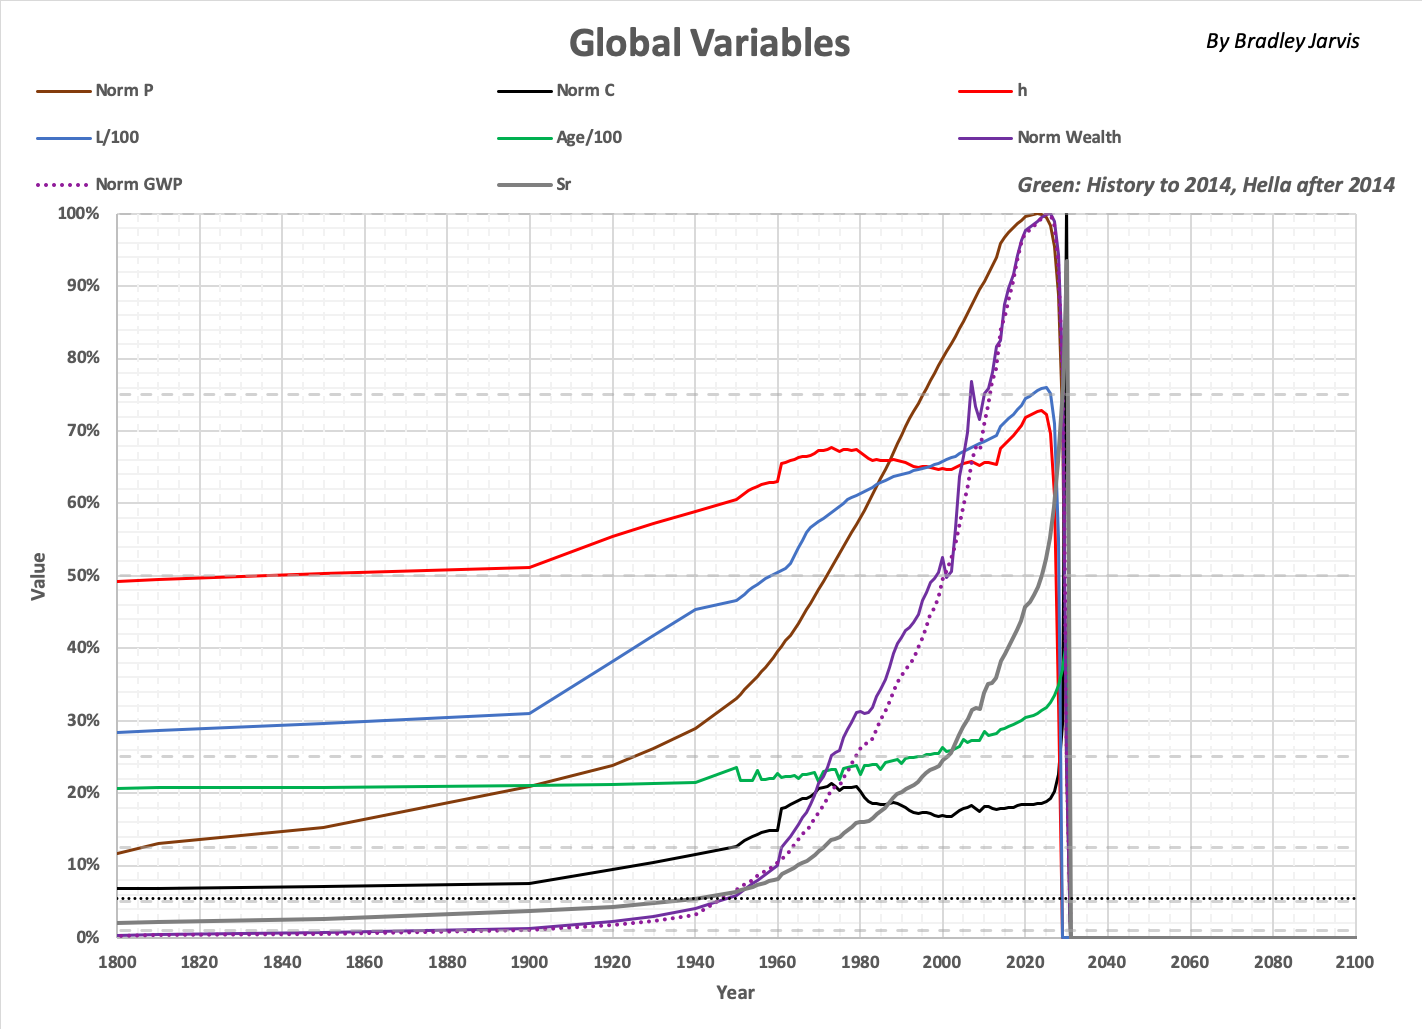
The following graph shows the relationships between global variables tracked in the Timelines model. Roll over to see the definitions as a function of phase.
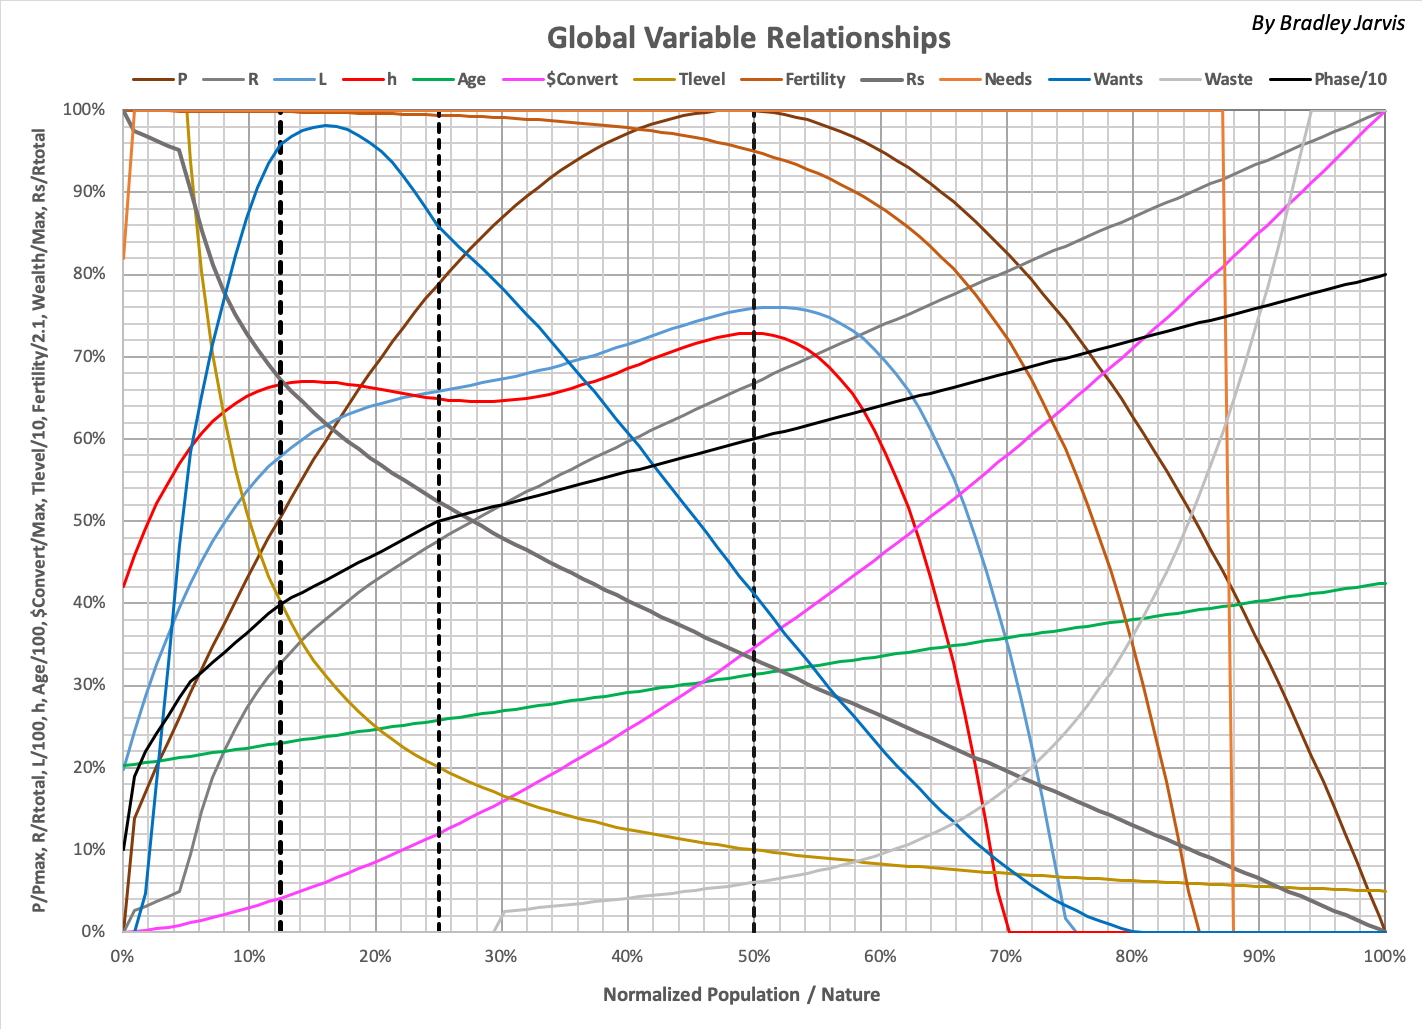
Definitions of variables and terms used here and elsewhere are as follows:
| adjusted impact | A self-sustained impact altered by human behavior (such as enabling other species to grow) |
| Age | Median age of a population, in years |
| C | Average consumption per person in a group |
| consumption | Ecological footprint of a person or group, expressed in ecological resources |
| ecological resource | Unit of ecological footprint corresponding to an average person's annual basic needs |
| Fertility | Surviving children born per woman |
| h | Average happiness of a group (typically the global population) |
| happiness | Life satisfaction |
| impact, self-sustained impact | Change in ecological resources (typically a reduction) continually caused by a non-human source |
| L | Average life expectancy in years |
| Needs | Resources consumed for basic survival |
| Normalized Population / Nature | Sratio normalized to maximum 1.126; also: Sr |
| P | World population |
| Phase | Development level; each phase is expressed as a fraction of its Sr range |
| Pmax | Maximum world population as a function of Sratio |
| population | The number of people in a group, typically all the people in the world (global population) |
| R | Number of ecological resources consumed by a population |
| region | An arbitrary collection of resources and people |
| Rs | Amount of ecological resources remaining in the world, usable by people and other species |
| Rtotal | Total ecological resources in a region or (typically) the world |
| simulation | Set of mathematical projections of observable variables that define a universe |
| Sr | Normalized Population / Nature |
| Sratio | Ratio of min. consumption by people (needs) to remaining resources (P / Rs) |
| $Convert | Global inflation of U.S. dollars, as multiple of a value in 2010 |
| Tlevel | Trophic level (members of standard other species per person) |
| total consumption | The consumption of everyone in the world |
| universe, world | Theoretical reality defined by a simulation, based on history in the real world |
| Wants | Resources consumed for purposes other than needs |
| Waste | Resources not consumable by people or other species |
| Wealth | Wealth in U.S. dollars (2010 value unless otherwise indicated) |
| Wealth/p | Average wealth per person in U.S. dollars (2010 value unless otherwise indicated) |
| Year | Middle of given calendar year (A.C.E.) |
Black dotted lines indicate where "stages" of development are crossed in what can historically be considered as humanity's lifecycle.
The distributions of global variables are simulated using 300 regions defined by randomly selected values in projected ranges of Sr and region Rtotal. One such simulation, "Green," is shown below the year 2019. Roll over the image to see how the variable change by phase.
_2019.png)
The ranges are chosen so the totality of the regions is within 5% (typically < 1%) of a projected world total.
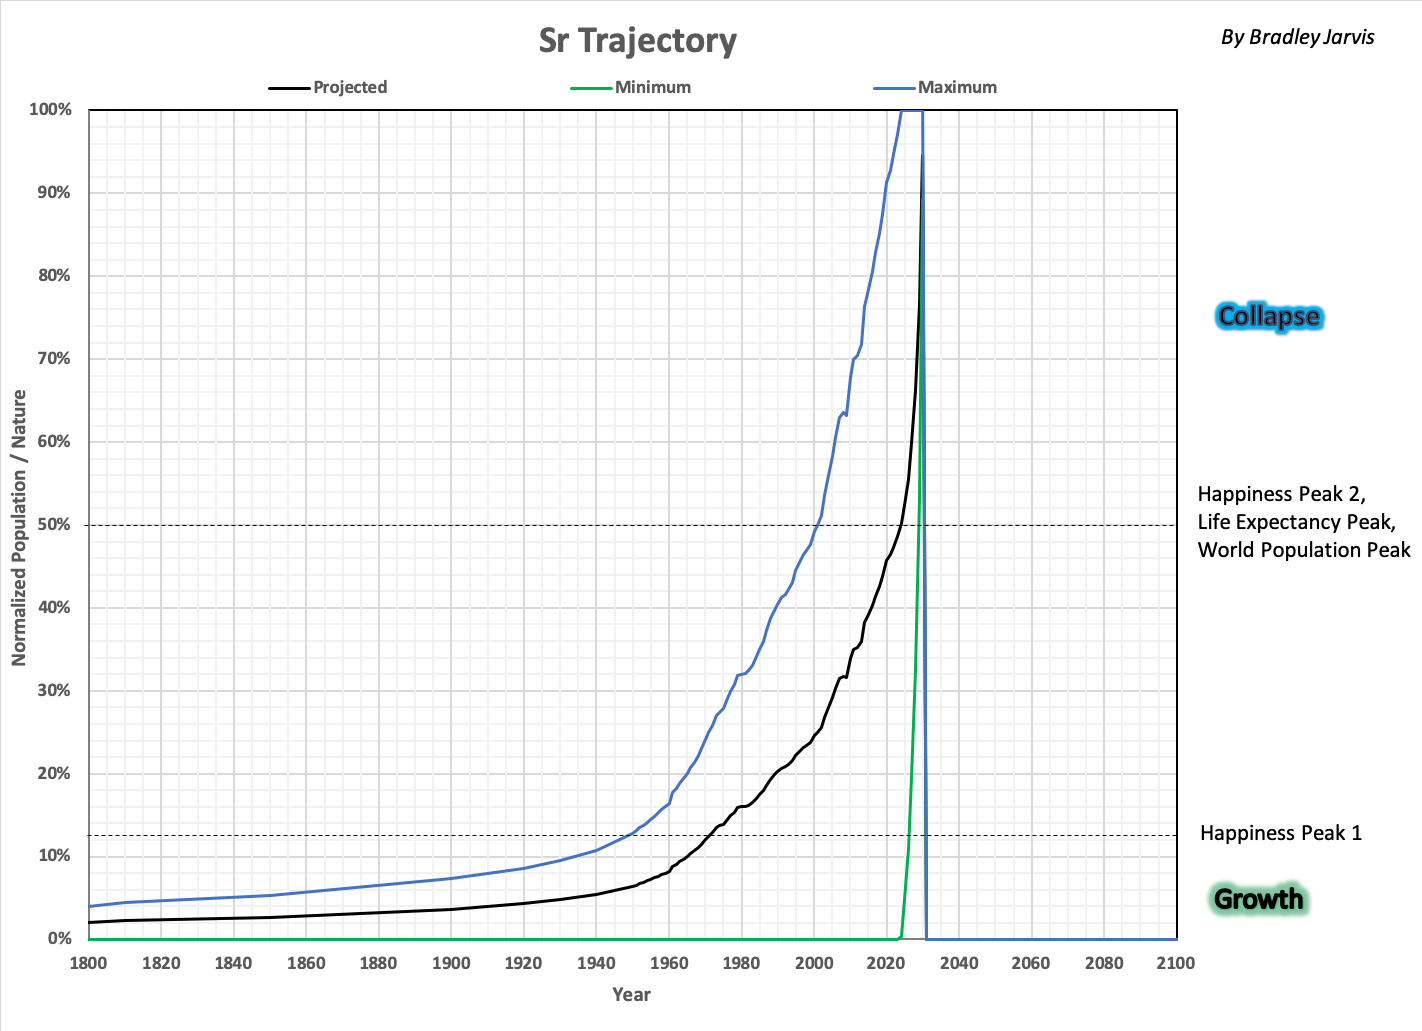
Projected world totals for Sr are shown below for simulation Green, which includes values derived for history until 2014. Roll over the image for phase.
See also:
- Simulated News blog (a fictional treatment of the model that includes "Reality Check" discussions of the underlying research)