Timelines (V2)
Version 2 of the Timelines model is a means of reconstructing values of global variables in history and projecting them into the future as "timelines."
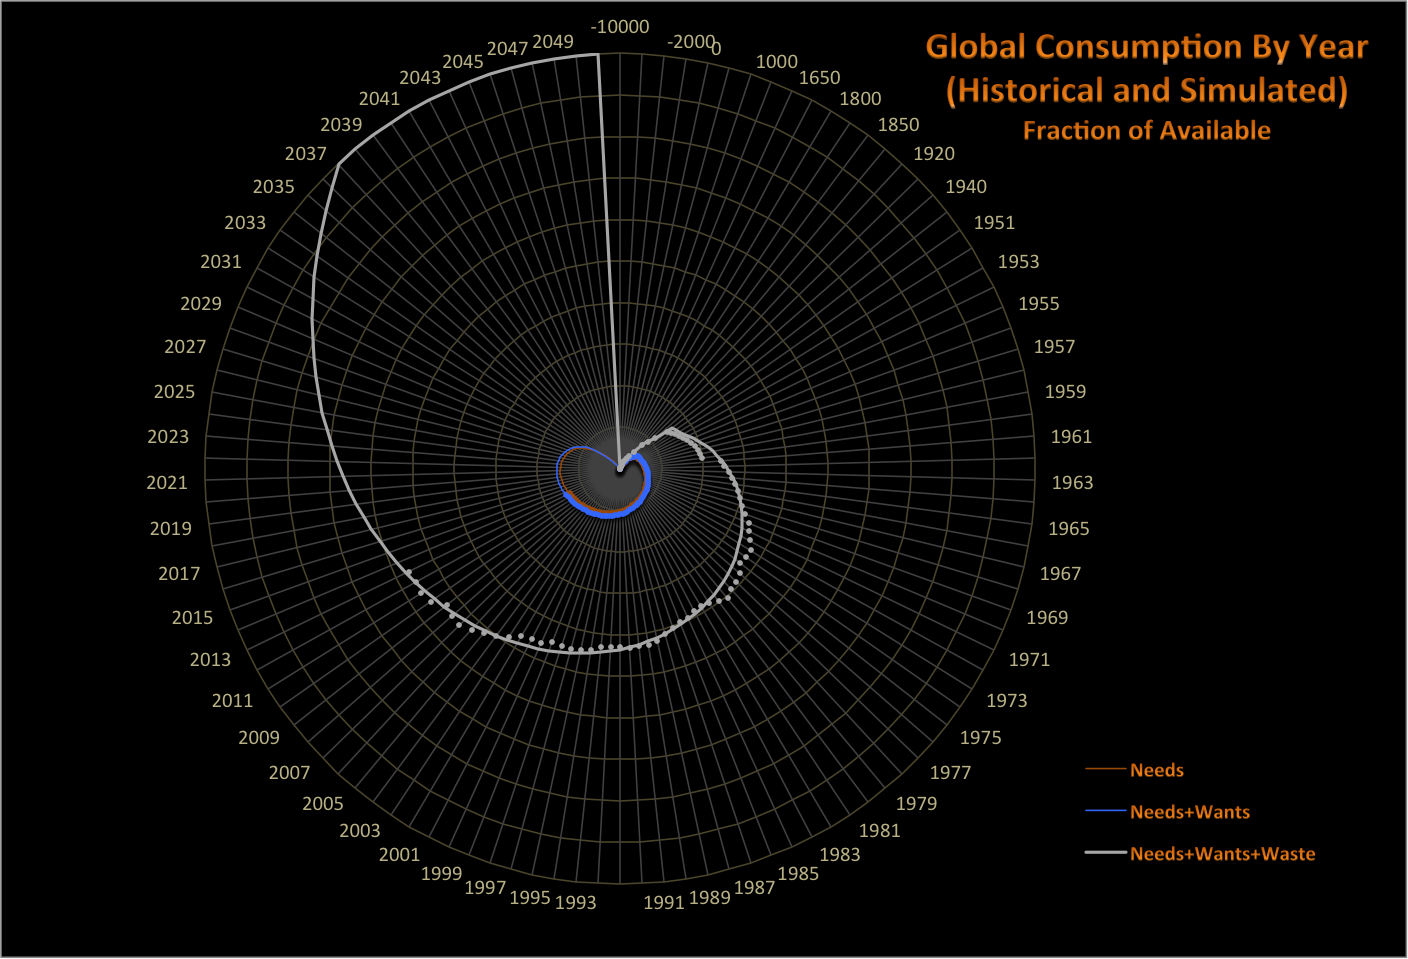
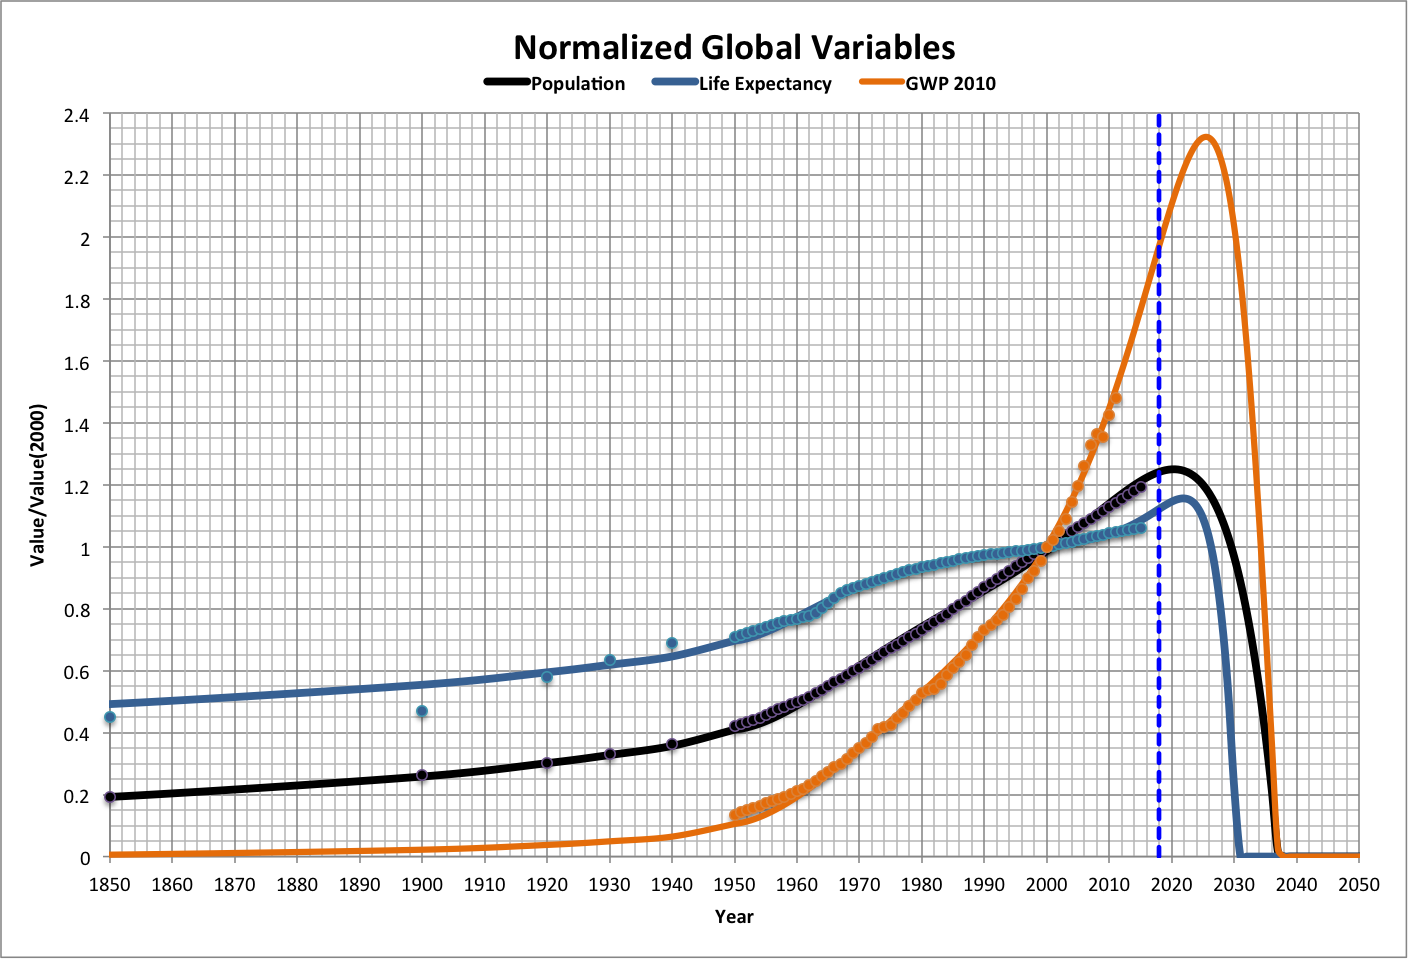
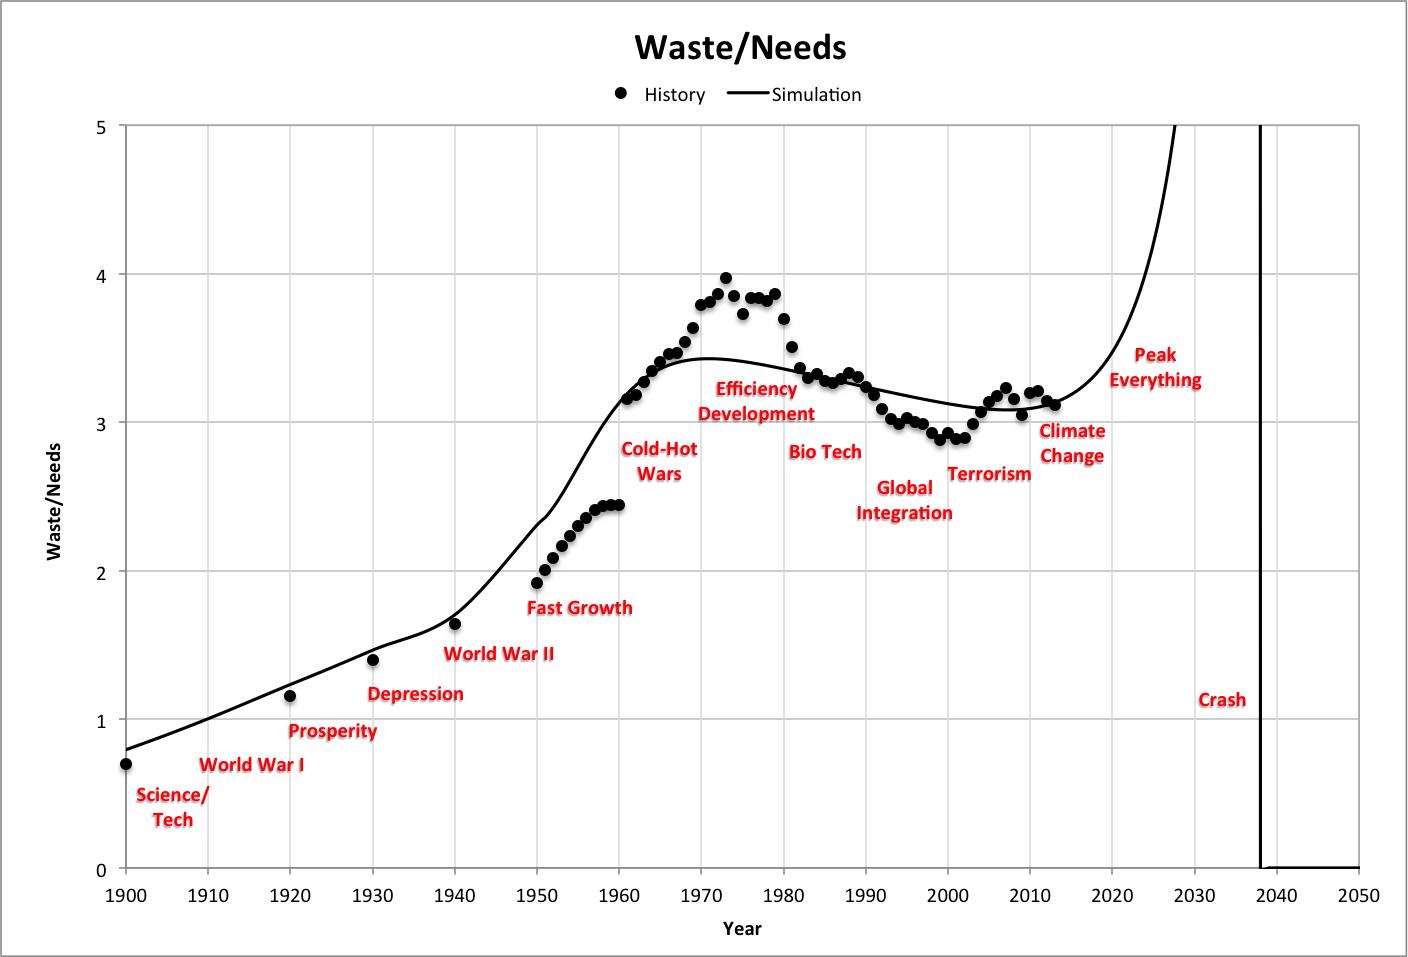
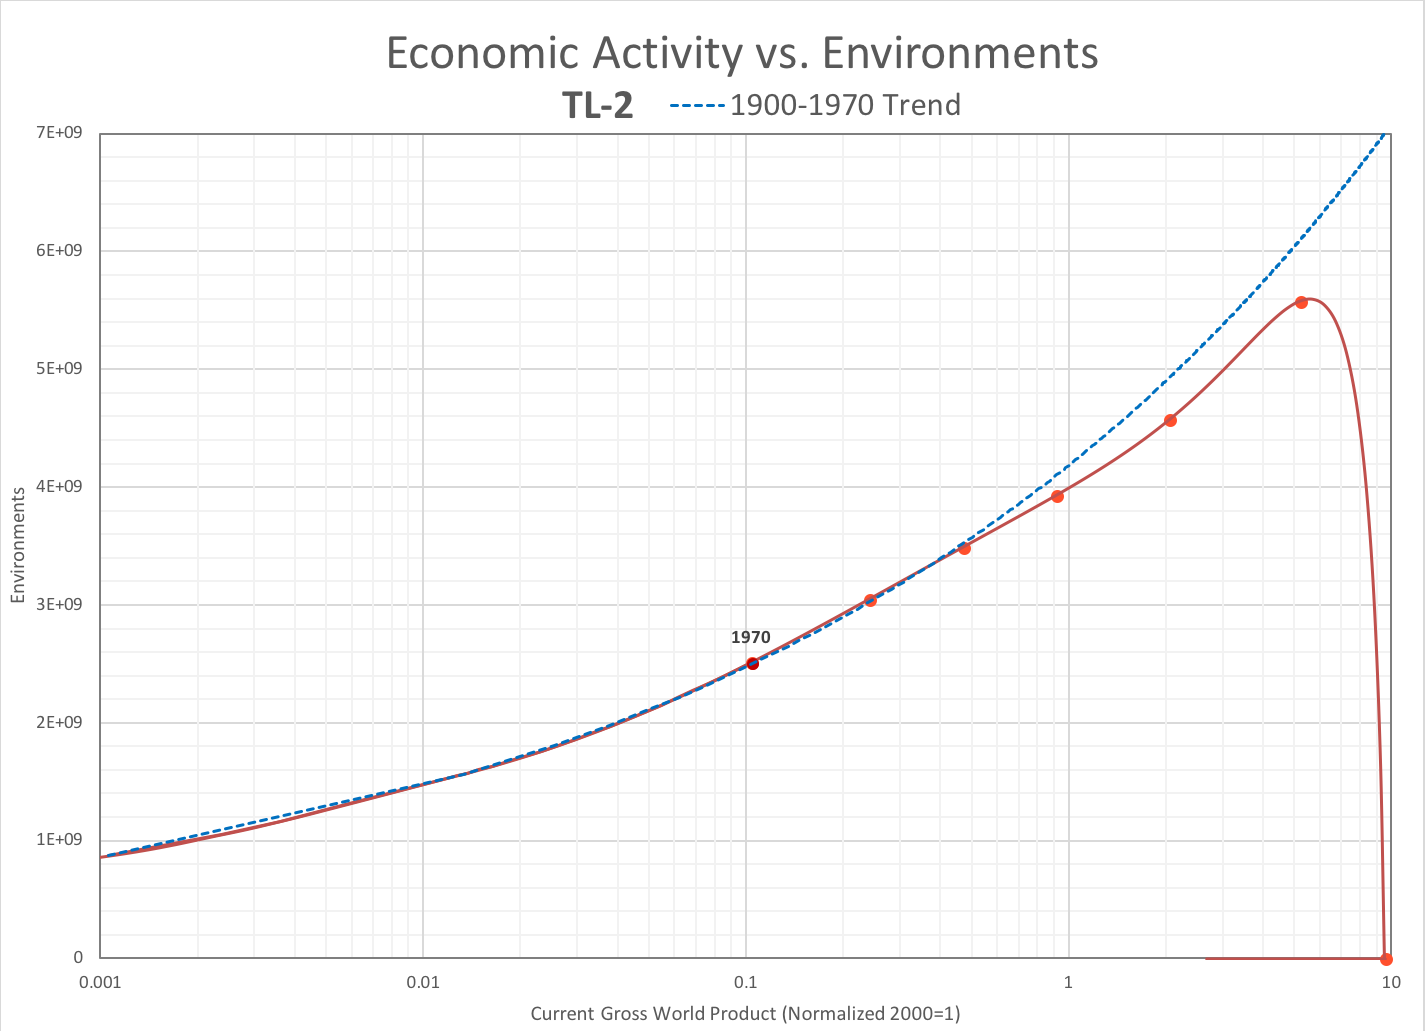
Following is some of the model's output, highlighting the historical data (dots) and the timeline with the closest match to the data (solid line) along with some of that timeline's significant events. For consistency, this simulation will be referred to as Timeline 2 or TL-2. A potential split in 2018 that does not result in near-term extinction will be referred to as the Fix timeline.
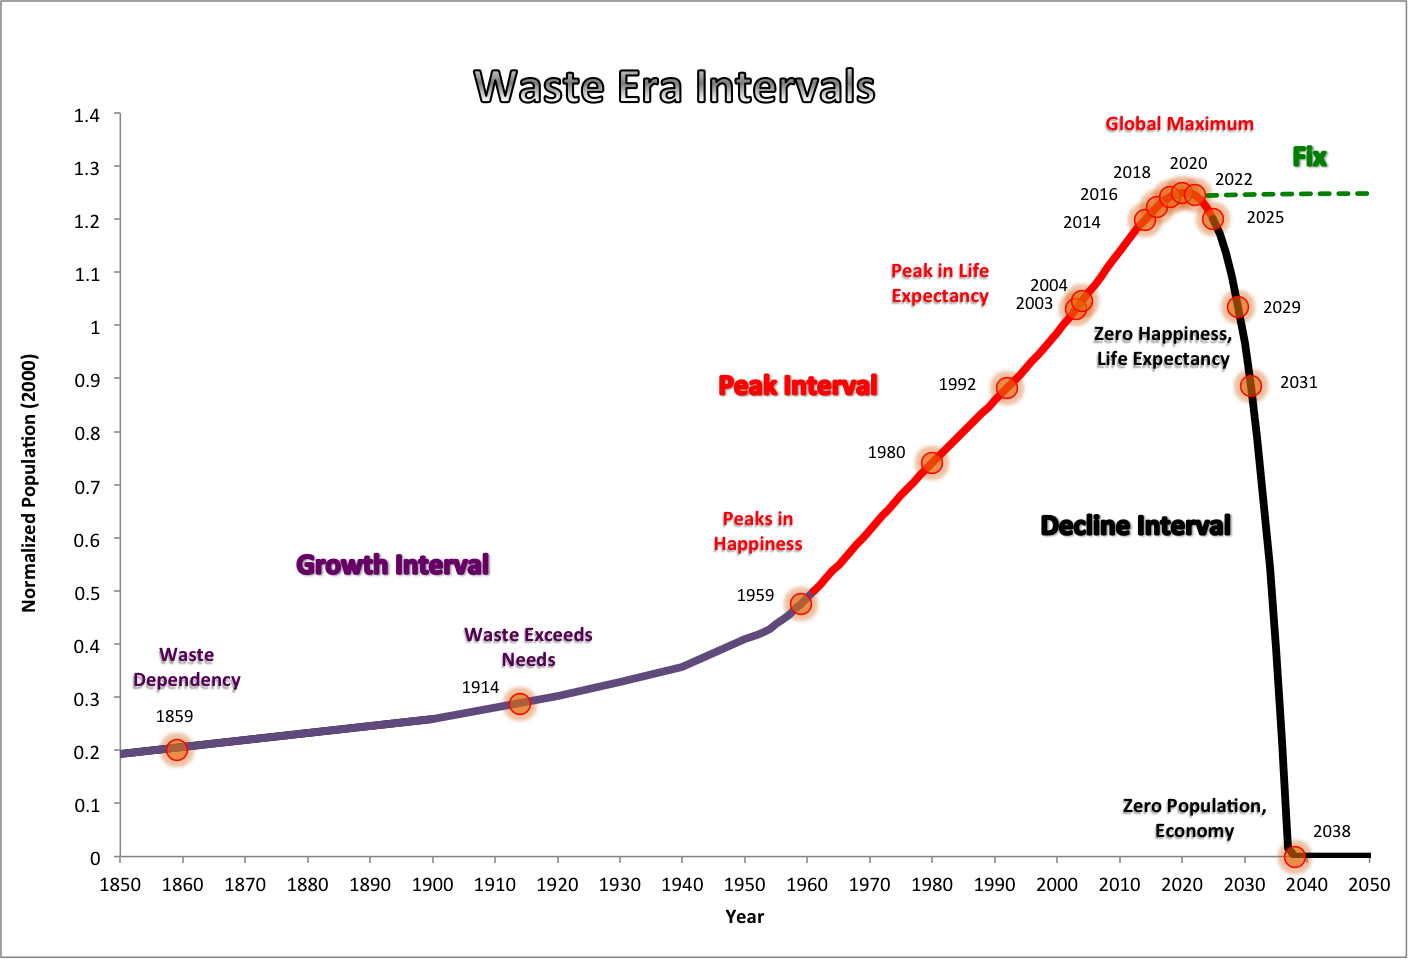
| 1859: Economic inversion (GWP becomes waste-dependent). |
| 1914: Waste exceeds needs. |
| 1959: Happiness over population peaks. |
| 1980: Happiness peak falling to lowest half of population. |
| 1992: Happiness at highest consumption climbs above peak at lower consumption. |
| 2003: Happiness over population peaks again. |
| 2004: Life expectancy over population peaks. |
| 2014: Happiness drops to zero at high consumption. |
| 2016: Life expectancy drops to zero at high consumption. |
2018: Fix may start. |
| 2019: Optimum happiness (most efficient for average person). |
| 2020: Peak population. |
| 2021: Peak happiness. |
| 2022: Peak life expectancy. |
| 2025: Peak inflation-adjusted GWP. |
| 2029: Happiness reaches zero. |
| 2031: Life expectancy reaches zero. Peak current GWP. |
| 2038: Population and GWP reach zero. Waste persists. |
See also:
- Relationships (technical aspects of the model)
- Fix Timeline
- Values (people, longevity, and happiness)
- Gradients
- Personal Consumption and Happiness (optimum happiness)
- Top Fraction Views
- Blog posts
- Timelines (discussion of version 1)
- Waste Age (discussion of version 2)
- Fix (Fix timeline)
- Contagion (social manifestations)
- The Extinction Test (people as a value)
- Values Realized (values in timelines)