Top Fraction Views
How variables change over the global population can be viewed in terms of the fraction of the population experiencing them. This page shows change over time for several of these variables: life expectancy, happiness, current wealth per person, median age, and the three consumption components (needs, wants, and waste).
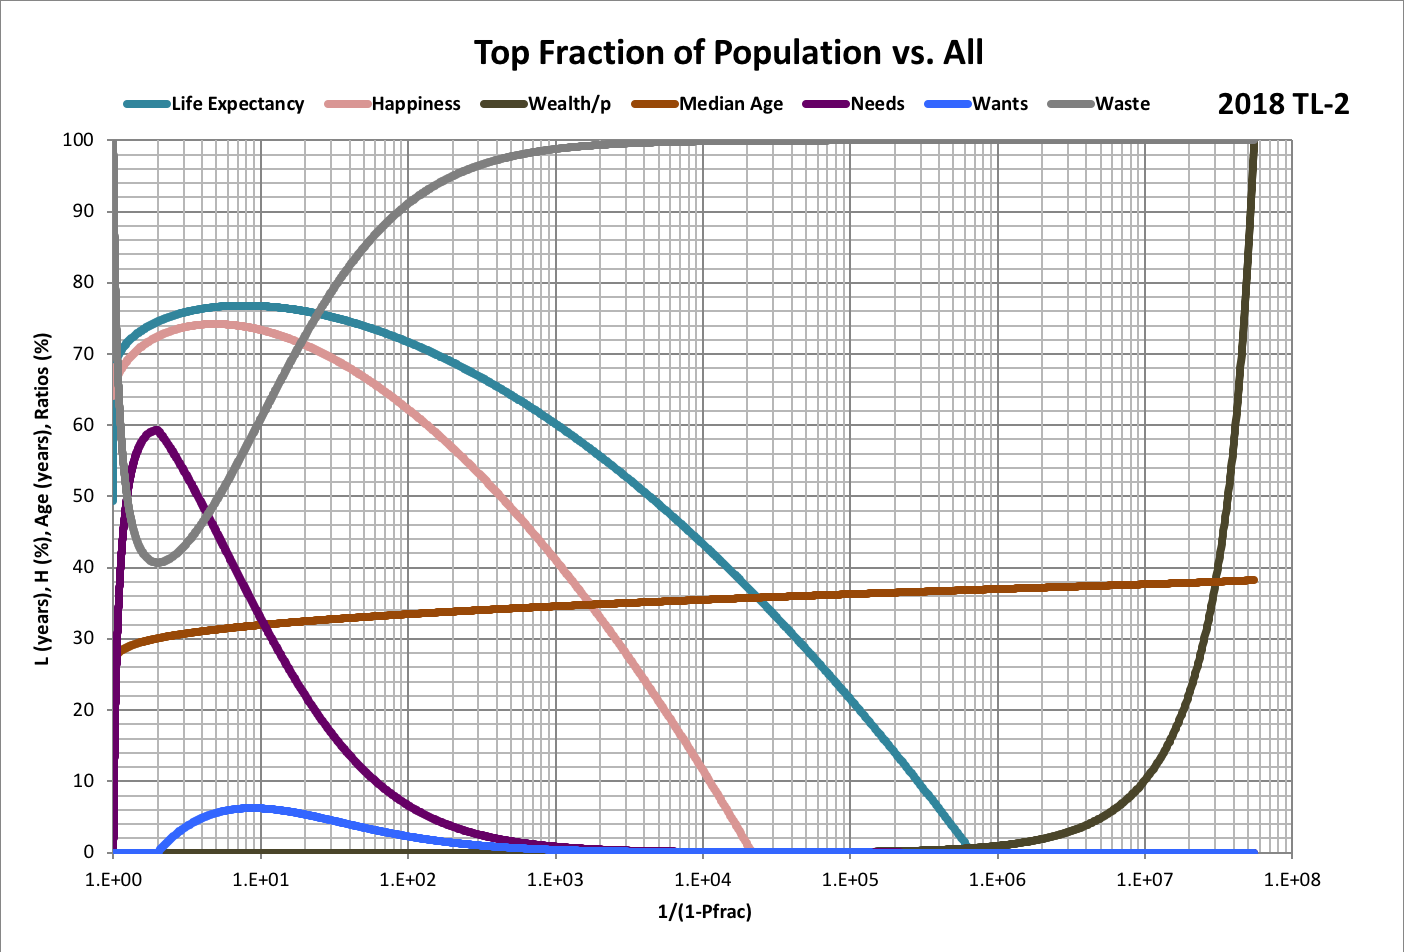
The top fraction is defined in terms of the population fraction Pfrac as 1 - Pfrac. The reciprocal of the top fraction (1 / top fraction) is a useful way to display this fraction in graphs of variables, as illustrated below for the year 2018 in Timeline 2.
In this example, the needs ratio is at its maximum (peak) at 2 on the x-axis, which means that 1 in 2 people have values to the right of that point, while people at that half-way point consume 59% of their resources to meet their needs. Similarly, 1 in 10,000 (1.E+04) people are part of a group with a median age of at least 35.5 years.