Gradients
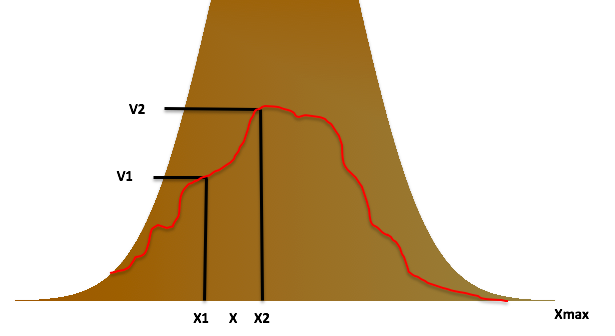
Each person in a population experiences values of global variables in common with others who consume the same amount of basic resources. The amount those variables change over the population is likely most meaningful between groups consuming a little less, and those consuming a little more of those basic resources than any person in the population. The changes for any particular variable form a "gradient" over the population.
The following diagram shows a variable V changing as a function of Xfrac = X / Xmax, where X is roughly proportional to the basic consumption per person. Xmax is divided into intervals X2-X1 wide, each corresponding to a value of X that is in common with every person in the population within that interval. V has values V1 and V2 for X1 and X2 respectively.
Each point of the variable's gradient, associated with each value of X, is calculated as V2 / V1. The diagram is not to scale, since the model divides Xmax into 5,000 intervals.
_2018_TL-2.png)