Population Variables |
Graphing how variables change within the world's population provides insight into what people might experience. This can be done using a statistical distribution of a random population as shown below, using either Xfrac (X/Xmax) or fractions of the population (Population Fraction, Pfrac) |
The following graphs show different views of life expectancy, happiness, cumulative wealth (the combined wealth of people within a given population fraction). The fraction of consumed resources dedicated to basic needs is also plotted in the animation, showing how these variables are expected to change in the future of Timeline 2. |
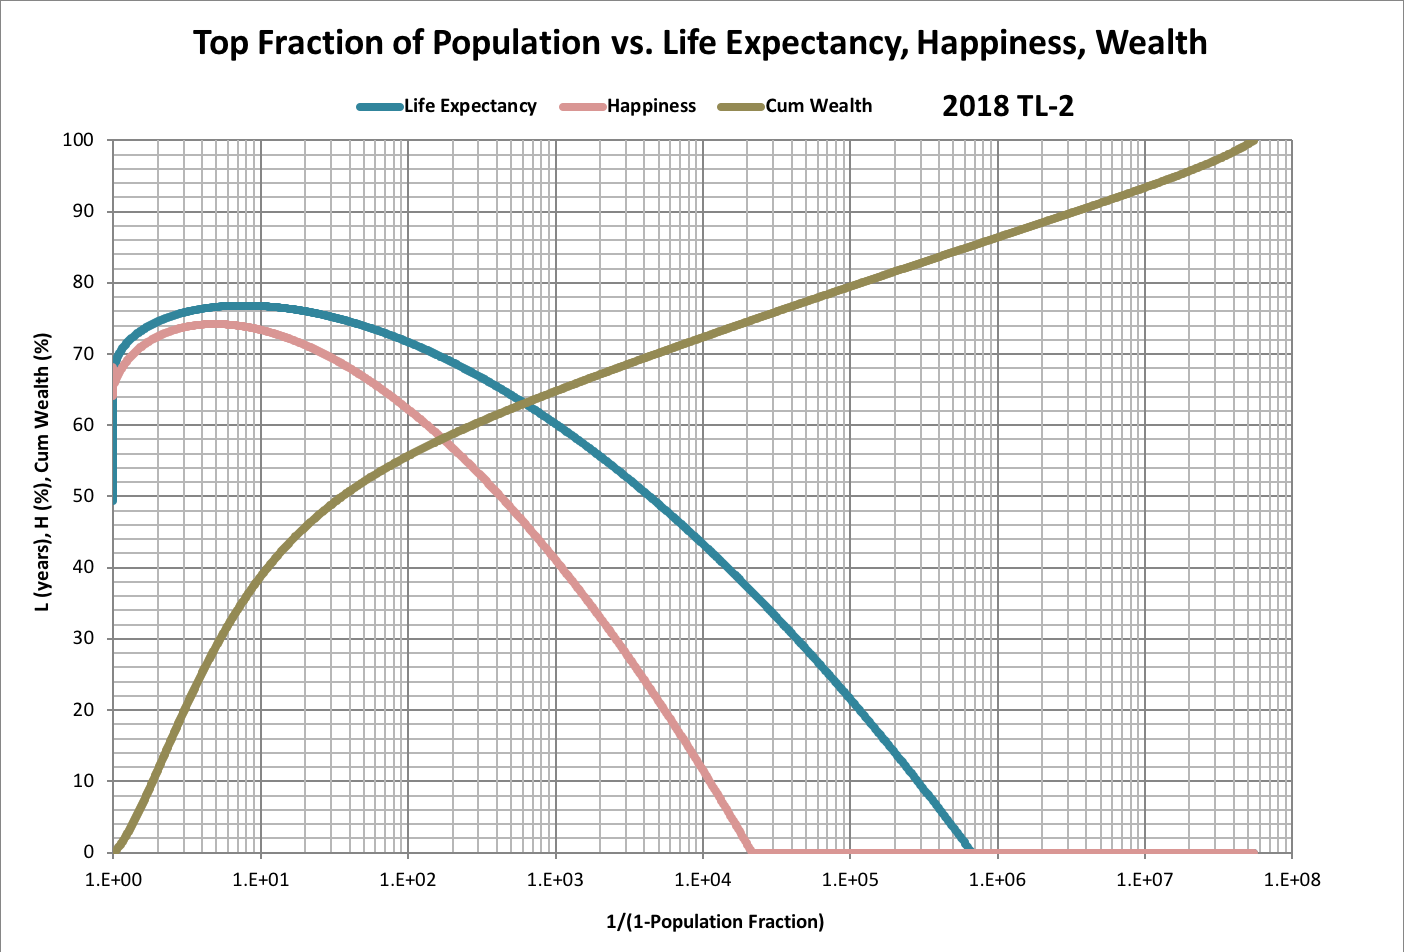
The following animation shows graphs for each decade since 1900. |
The distribution of the number of children in the population as a function of Xfrac is shown below as an mixed animation of Timeline 0 and Timeline 2 projections for the period 2005-2025. |
© Copyright 2018 Bradley Jarvis. All rights reserved. |