 |
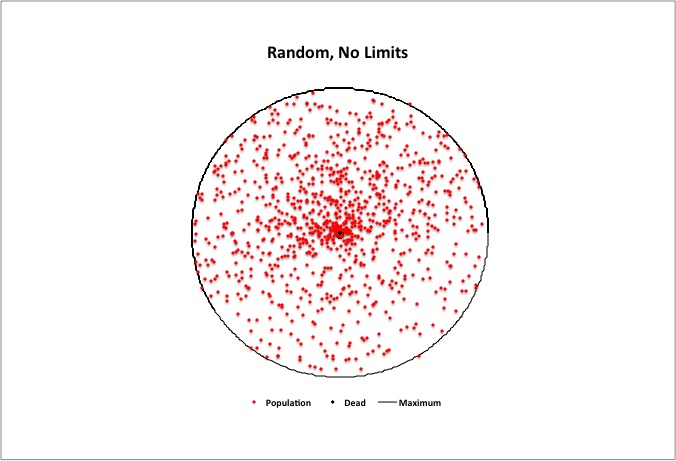
In a population with no limits to happiness and no constraints on survival, everyone can attain their own level of happiness based on their abilities and chance.
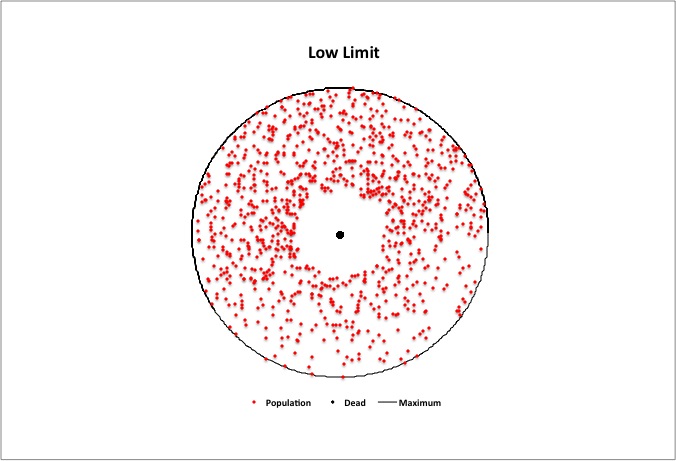
In these diagrams, each point represents one or more members of a random population, and the distance from the center corresponds to happiness (life satisfaction). |
 |
With more resources, the society may be able to raise the lowest limit of happiness for the population without changing the maximum. |
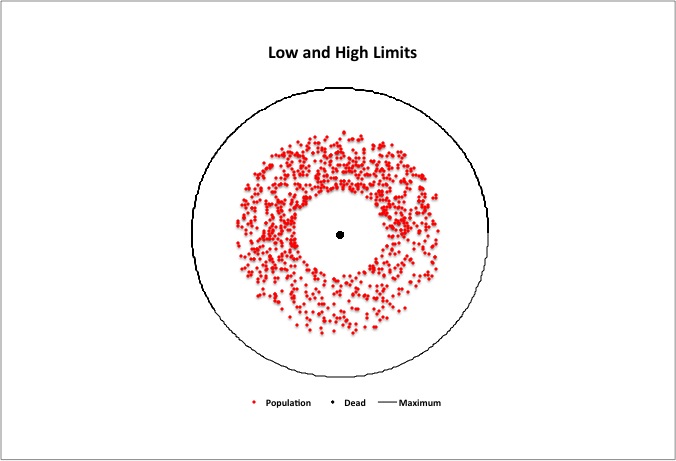 |
With limited resources, the society may lower the upper limit to pay for maintaining the lower limit, or may simply be unable to afford to support happiness above a certain level. |
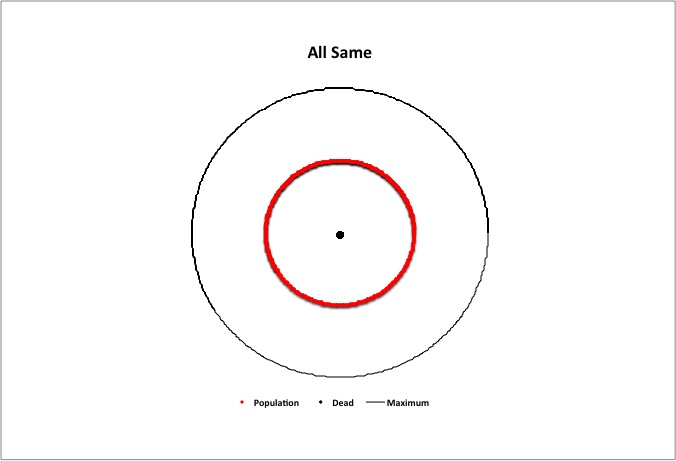 |
The upper and lower limits can only be adjusted so far, resulting in a common value for everyone. |
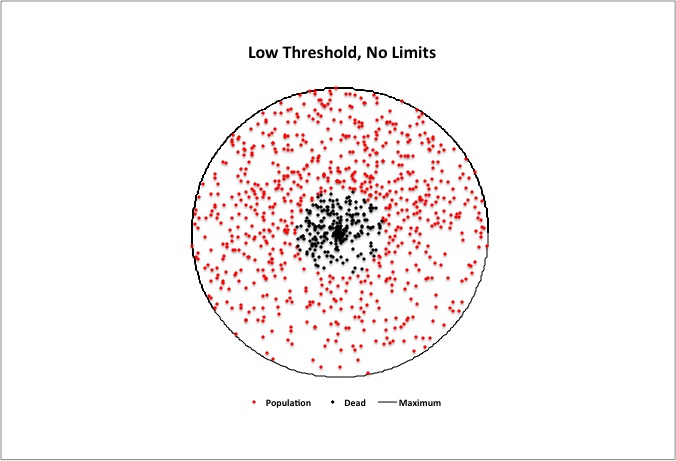 |
If falling below a certain threshold of happiness lowers the chances of survival, and society cannot or will not raise the lower limit above that threshold, then people will die. |
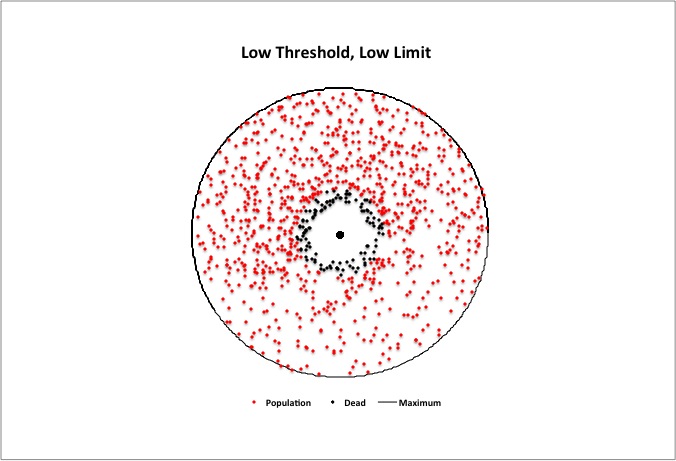 |
The more the society can raise the lower limit of happiness in the presence of a survival threshold, the fewer people will die. |
|
The world's happiness distribution appears to currently have only a low limit.
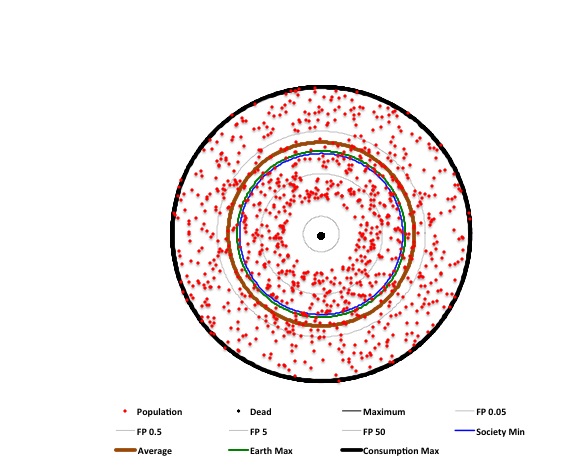
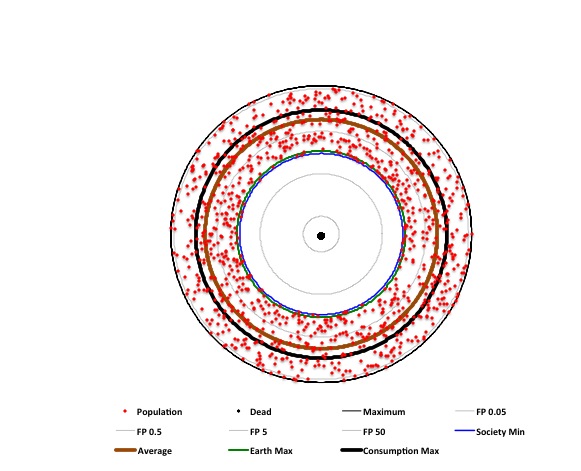
Nature can support a limited amount of consumption (Earth Max) - equated to happiness,* and a minimum is required to maintain a healthy society.
Average consumption is currently above both limits and increasing.
|
|
If the world lived like the United States, at its present population it would be six years away from exhausting its resources (the thick black circle represents one year to total depletion). **
If the population grew to the size that can support that lifestyle, its 23 billion people would be two years away from exhausting its resources. |
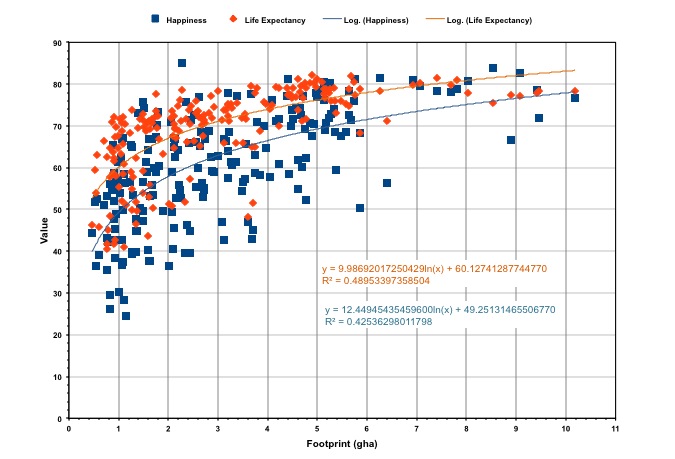
* Per capita ecological footprint in hectares F = EXP[(AverageHappiness% - 49.25)/12.45]
** F(Tmax) = Resources/(1000 * Population * Tmax)
*** Expected Population = FP * 2.51E+09
Graphs are based on a random population, with "happiness" indicated by the radial distance to a point (member), and each member indexed to an angle. Actual values are from "The Happy Planet Index 2.0" and the relationship between the ecological footprint and average happiness (see F above) is from a curve fit of all data for 2005 and values for selected countries in 1990 and 2000.
See also:
© Copyright 2011 Bradley Jarvis. All rights reserved.