Happiness Approximation
Using a curve-fit to global data, average happiness h is approximated by the equation
h = F / (1.22 * F + 7.2259E-11)
where F is per-capita ecological footprint in Earths/person/year.
This type of relationship can be summarized as
Consumption / Completion = a * Consumption + b
where
- Consumption is the amount of resources consumed per year, as a fraction of total resources available per year
Consumption = Consumed Resources / Total Resources
- Completion is the fraction of a task completed
In the case of happiness, achieving total happiness (h = 1) is the task
- a and b are constants
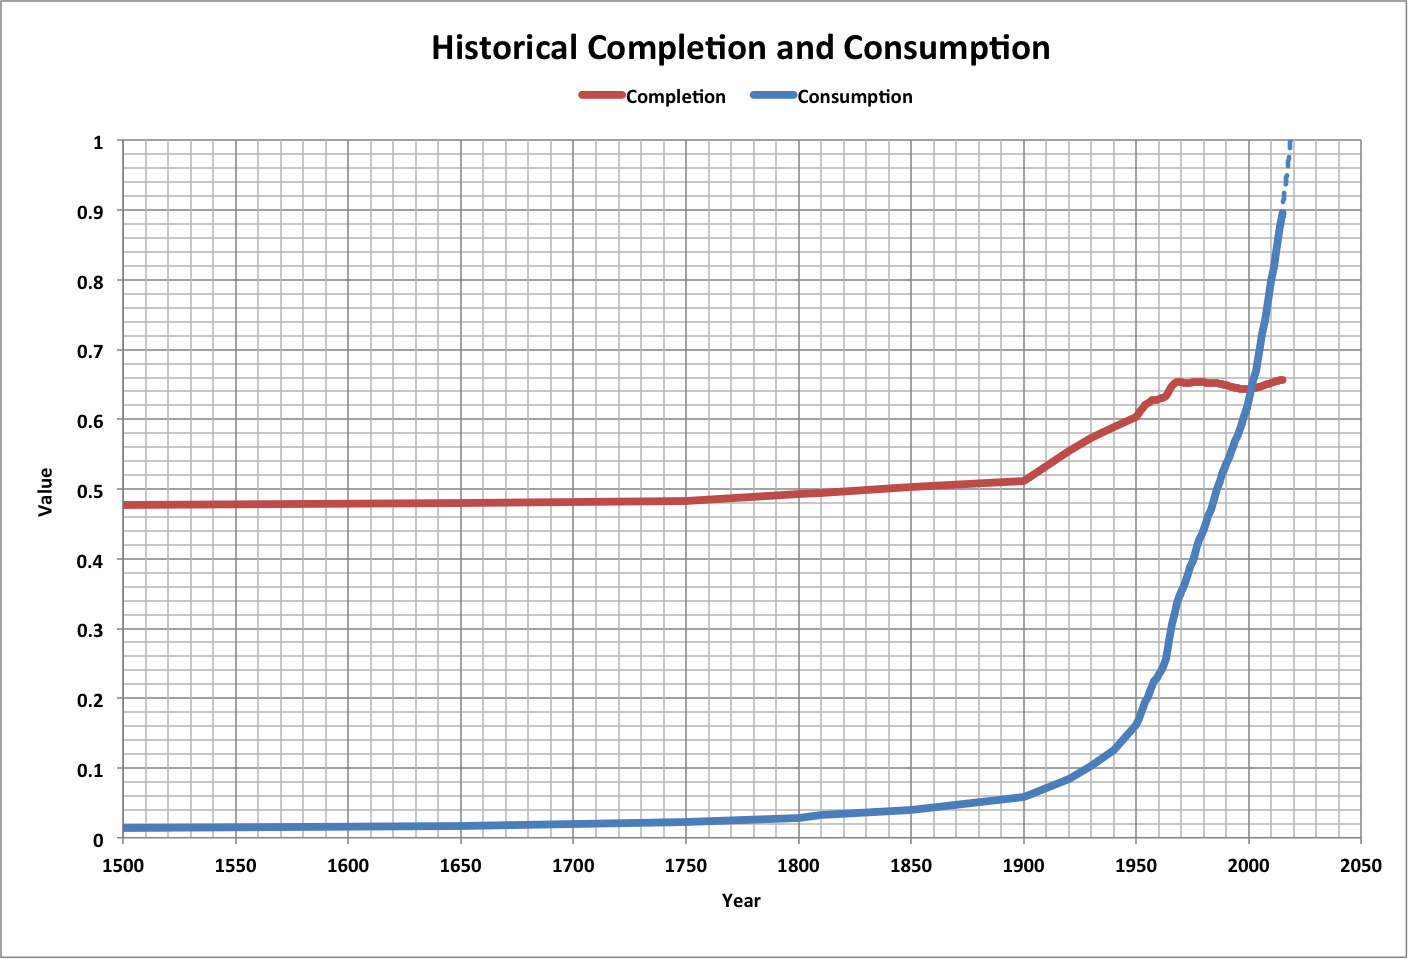
This relationship can be derived from a generalization of two observations: historical consumption of ecological resources, and completion over time.
In preparing the Worst Climate Case of global population and consumption, it was discovered that the speed of population and consumption over time varies with the amount consumed. This observation was used in a refined model that produced backcasting and associated futurecasting, and can be generalized as follows for a time t:
Consumptiont = Consumptiont-1 + Consumption Growth Rate * Consumptiont-12
where Consumption Growth Rate is a fraction.
Completion varies with time based on the fraction of the task that remains (1 - Completion) and the fraction of that which can be achieved in one unit of time (Completion Efficiency):
Completion = 1 - (1 - Completion Efficiency)t
With the task starting at a time determined by the initial completion, and that time used to determine the consumption, where there is an initial consumption at the start time, completion will become fixed when all resources are being consumed (Consumption = 1).
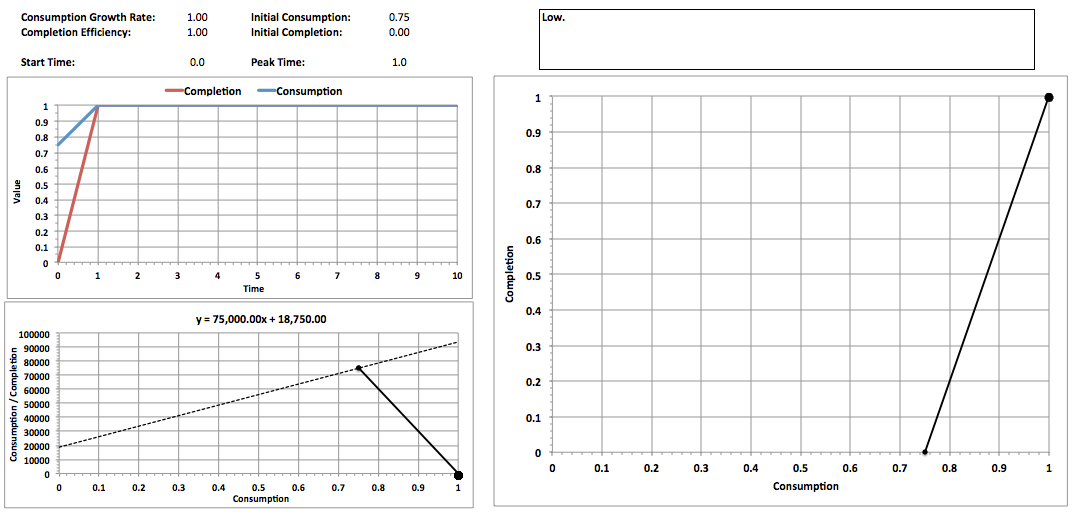
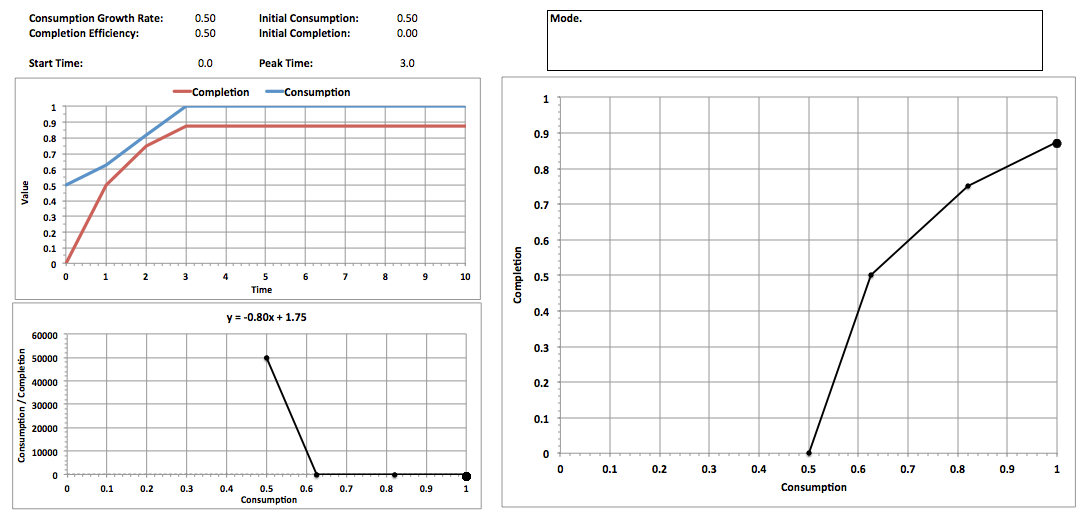
This is illustrated in the following example which simulates happiness over a lifetime, where Time is in years:
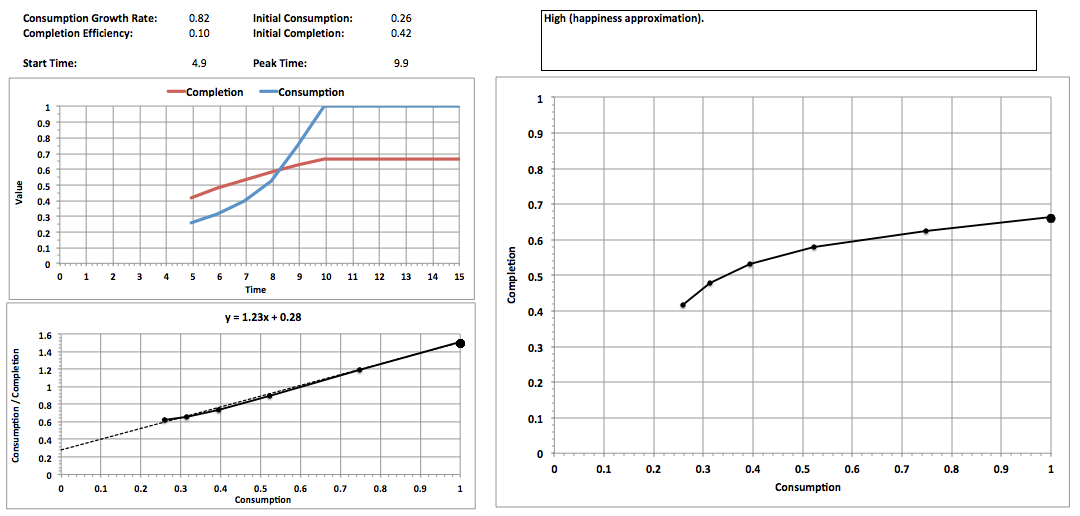
Note the following about this example:
- Data points are one unit of time apart (a year)
- The Consumption/Completion graph shows an approximate equation for its relationship to Consumption based on the most linear part of the curve
- Consumption Growth Rate is the average rate calculated using historical growth in F from 10,000 B.C. to 2015 A.D.
- Consumption and Completion assume lowest values in 10,000 B.C. and highest values in 2015
- Completion Efficiency is calculated so that the final Completion is the average happiness over life expectancy in 2015
- This simulation is one of three cases used to calculate a combination of consumption and completion that can be expected for planning purposes, representing the highest value of the time when completion peaks
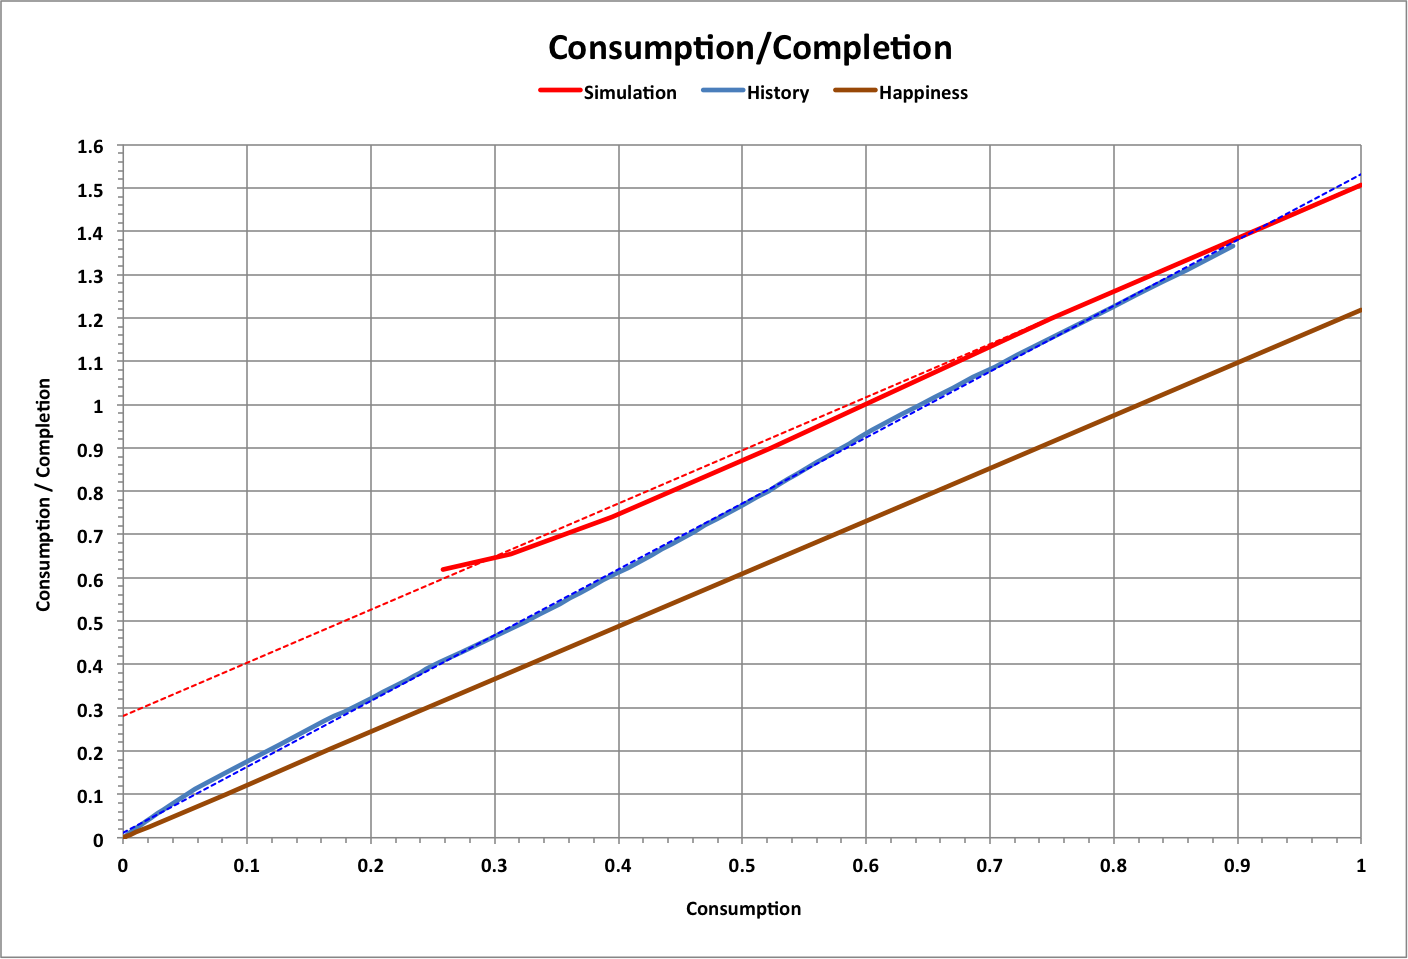
The following graph compares this simulation with happiness and with historical changes in happiness and per-capita footprint (including the changes to the limiting footprint based on population). Dotted lines are linear curve-fits to the data.
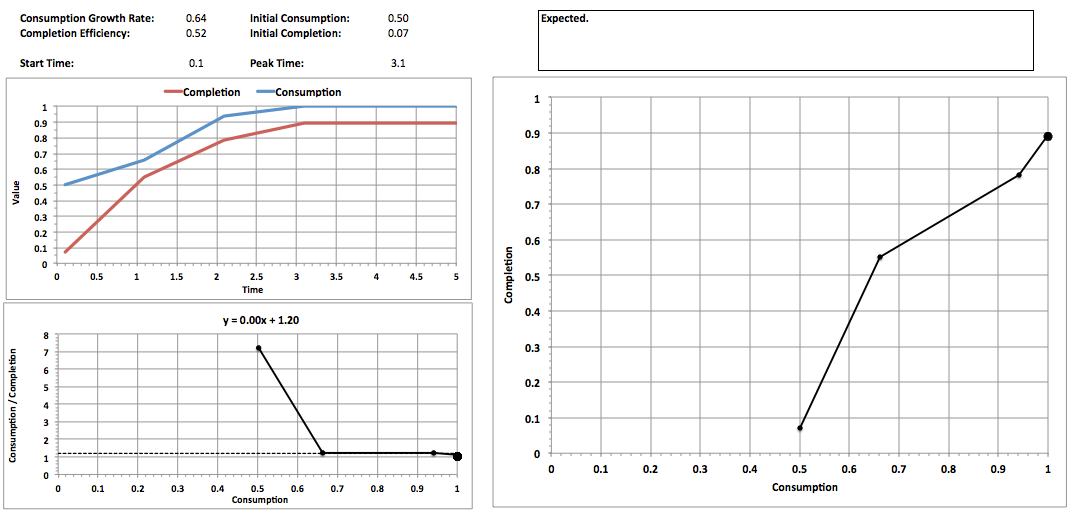
The expected case is determined using the PERT approximation to a normal curve for each variable:
Expected = (Low + High + 4 * Mode) / 6
The result is shown below, where the high values are from the first simulation above.
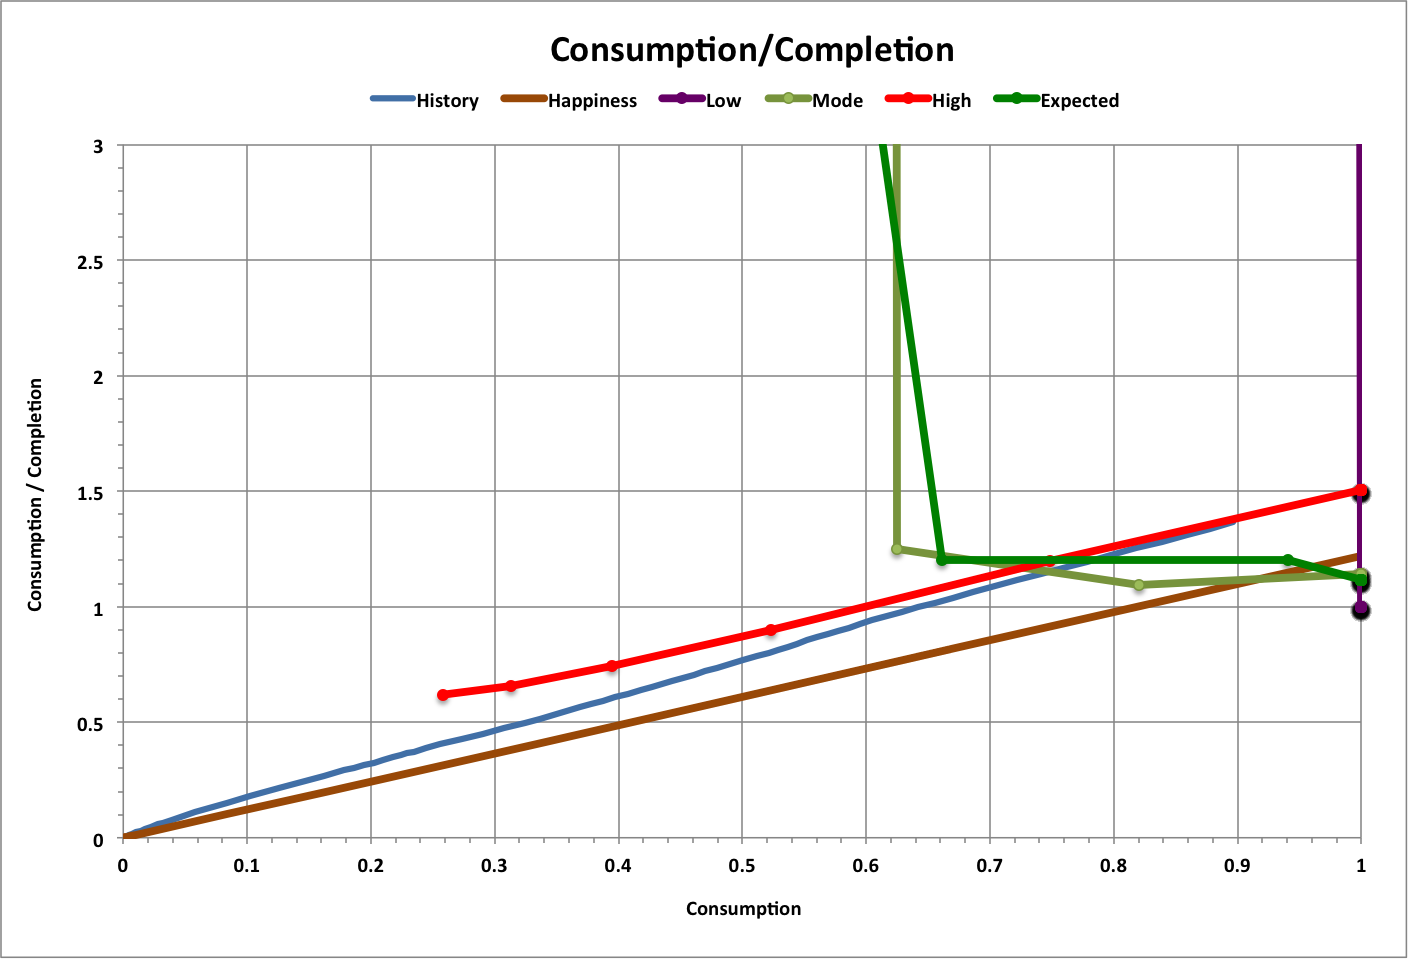
"Optimum" performance of a task occurs at the maximum amount of completion where completion equals consumption (Consumption / Completion = 1). This typically, but not always, happens when all resources are being consumed and completion is at its peak.
Below are results for a sample of 100 cases with random values between 1E-10 and 1 for all variables (Consumption Growth Rate, Completion Efficiency, Initial Consumption, and Initial Completion), along with linear curve-fits to the data.
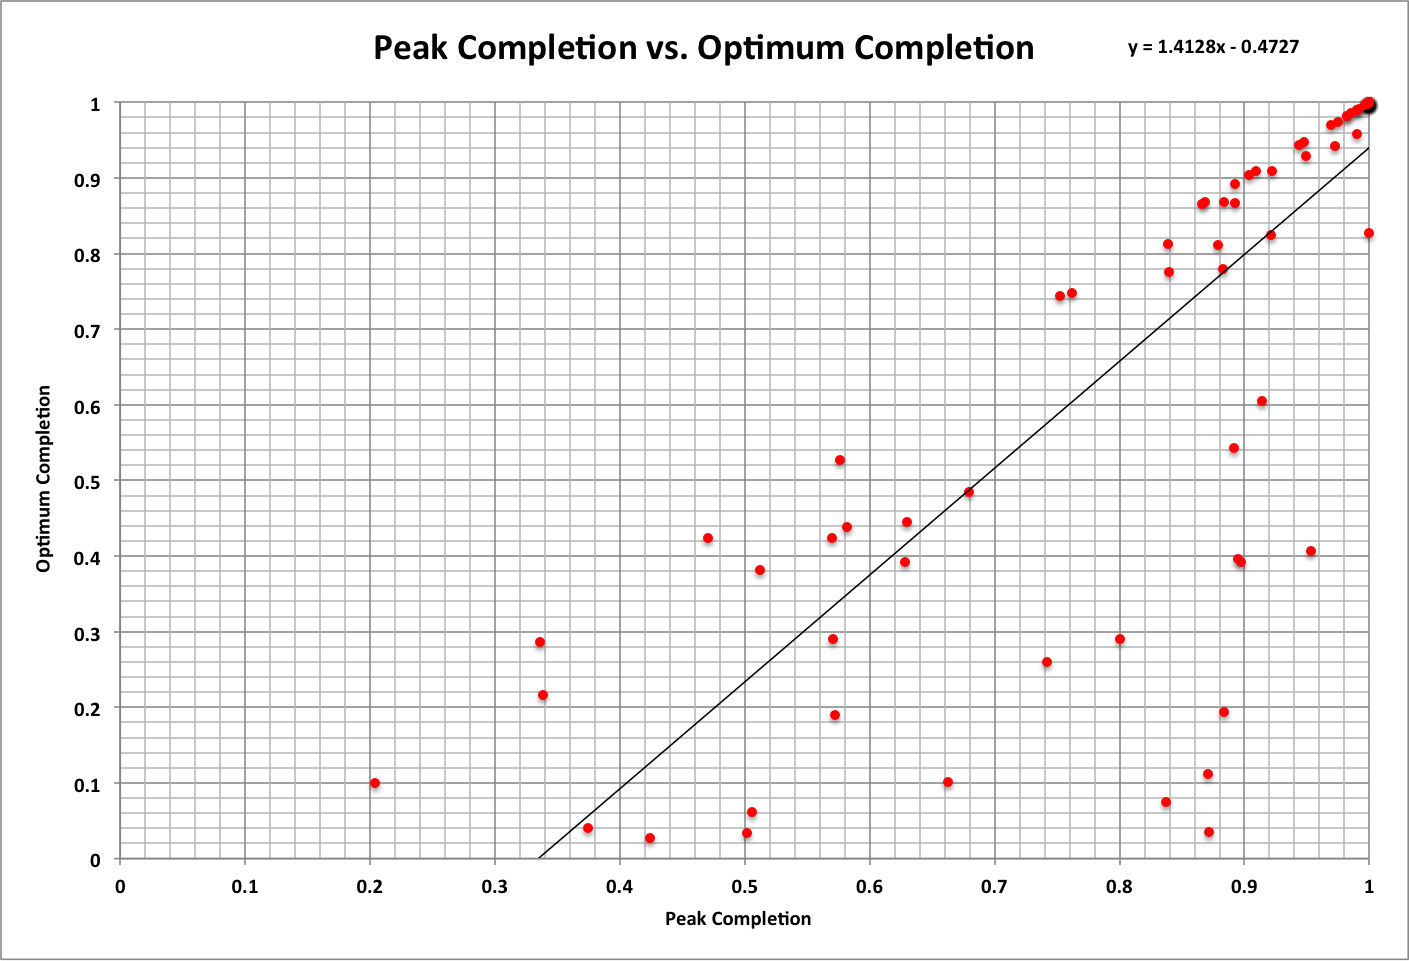
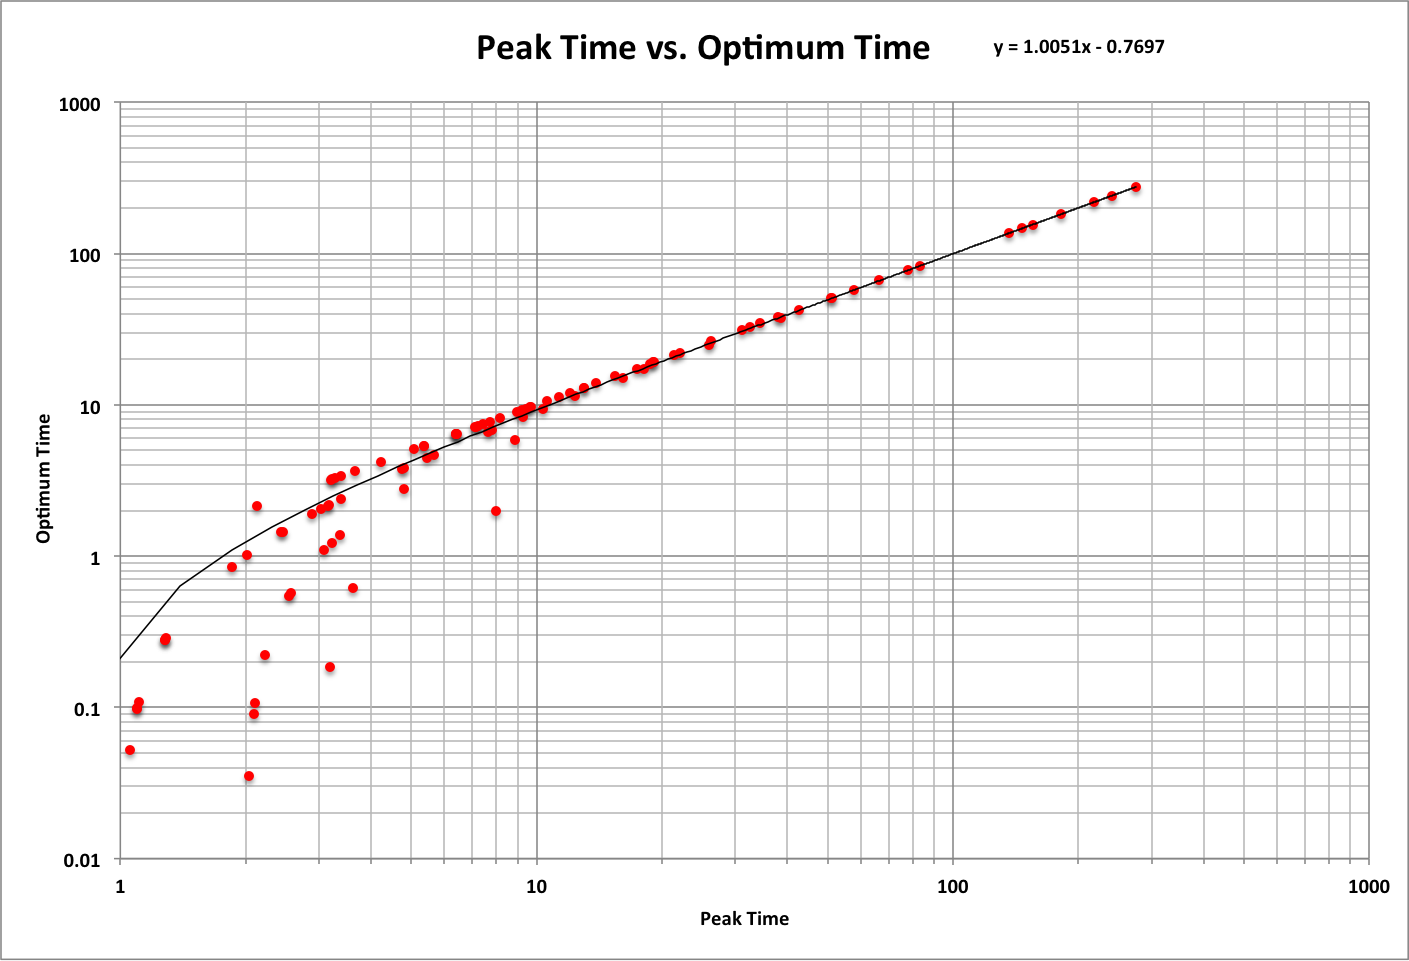
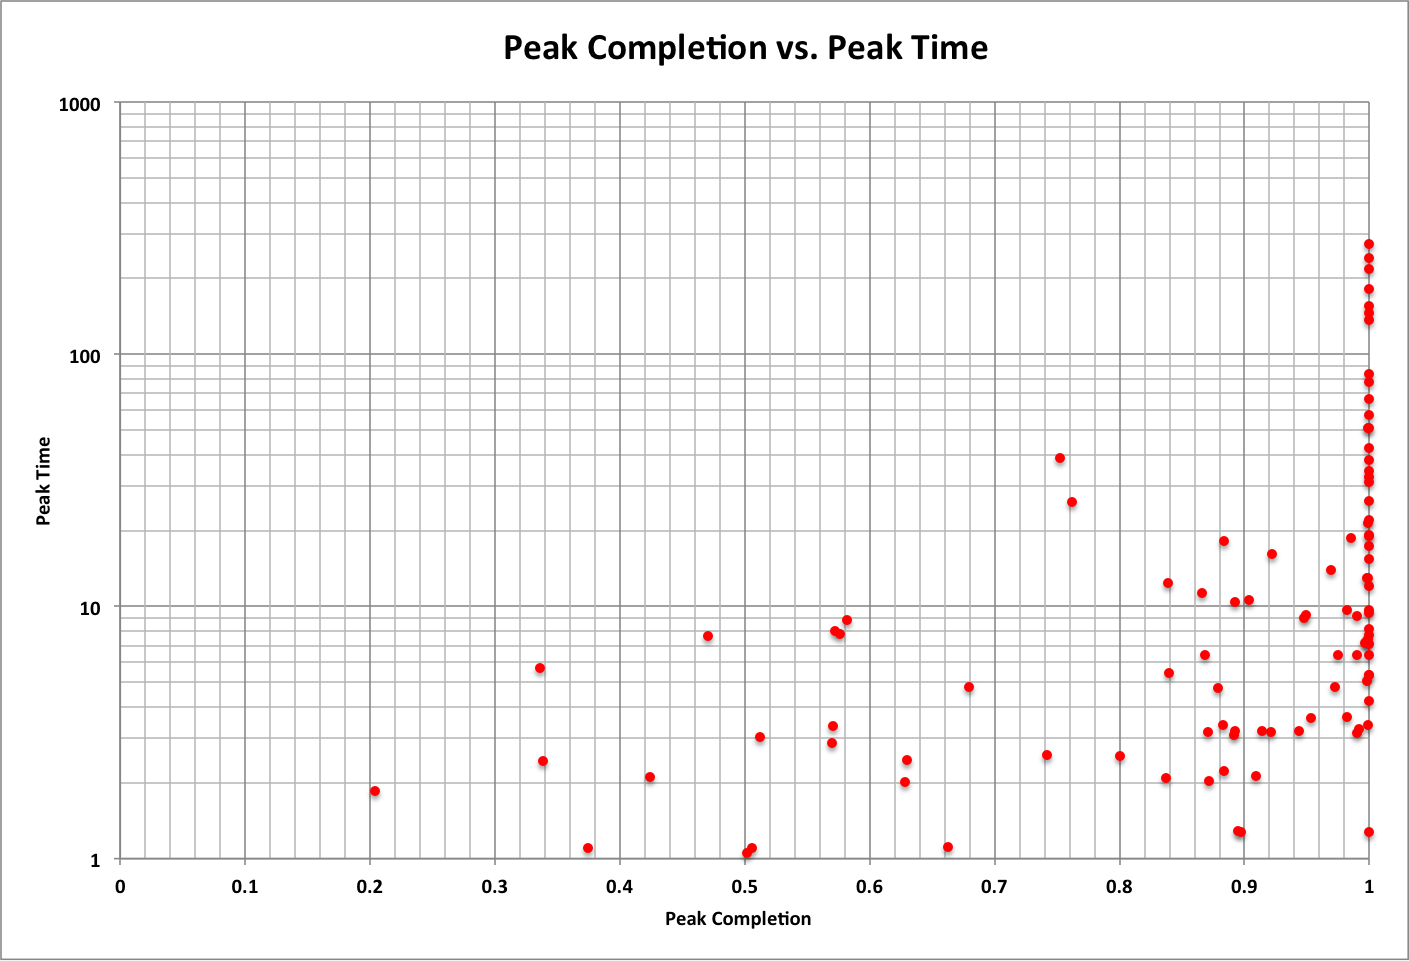
Based on these results (where the probability of each data point is 1%):
- The probability of peak and optimum completion being the same is 57%
- There is more than a 99% probability that the minimum time for a task to be completed is 19.1
- The probability of a task being completed (Completion = 1) is 14%, which is also optimum
- The average peak time is 25.6 and the average optimum time is 25.0
- The average peak completion is 87% and the average optimum completion is 76% ; average of both is 82%