Normal Completion
Observations of the time taken to complete a task have shown that the actual time asymptotically approaches the minimum possible time (see the blog post "Efficiency and Completion Time").
Where time t is time in units of the minimum completion time, C is the amount of completion (fraction of total task completed), and E is efficiency (fraction of task actually completed at t = 1):
(1 - E)t = (1-C)
Efficiency for different values of time are graphed below:
.png)
Assuming that efficiency is randomly distributed across the world's population (according to a bell curve), and that efficiency spans a range from 0 to 1 across the width of the distribution, the fraction of the population with efficiencies greater than a given value of efficiency is the "population fraction":
Population Fraction = 1 - Pop(E) / P
where:
- Pop(E) is the population with an efficiency less than or equal to efficiency E
- P is the total population
The normalized distribution and the population fraction are graphed below for the year 2013. Roll over the image for values at the beginning of civilization.
_2013.png)
_2013.png)
_2013.png)
The population fraction is graphed below as a function of completion, for time values of 1, 2, and 3 in 2013. Roll over the image to see values for the beginning of civilization.
_2013.png)
_2013_log.png)
_2013.png)
_half.png)
Given the spread in the distribution width over time, the efficiency and completion time for any given point in the population distribution (other than the average) will have changed.
The following graph shows this change for the central bulge of the bell curve as defined by the range Z = -1 to Z = +1 (Population Fraction = 0.84 to Population Fraction = 0.16). Roll over the image for how t for C = 0.95 has changed over history.
_95.png)
_Z1_2013.png)
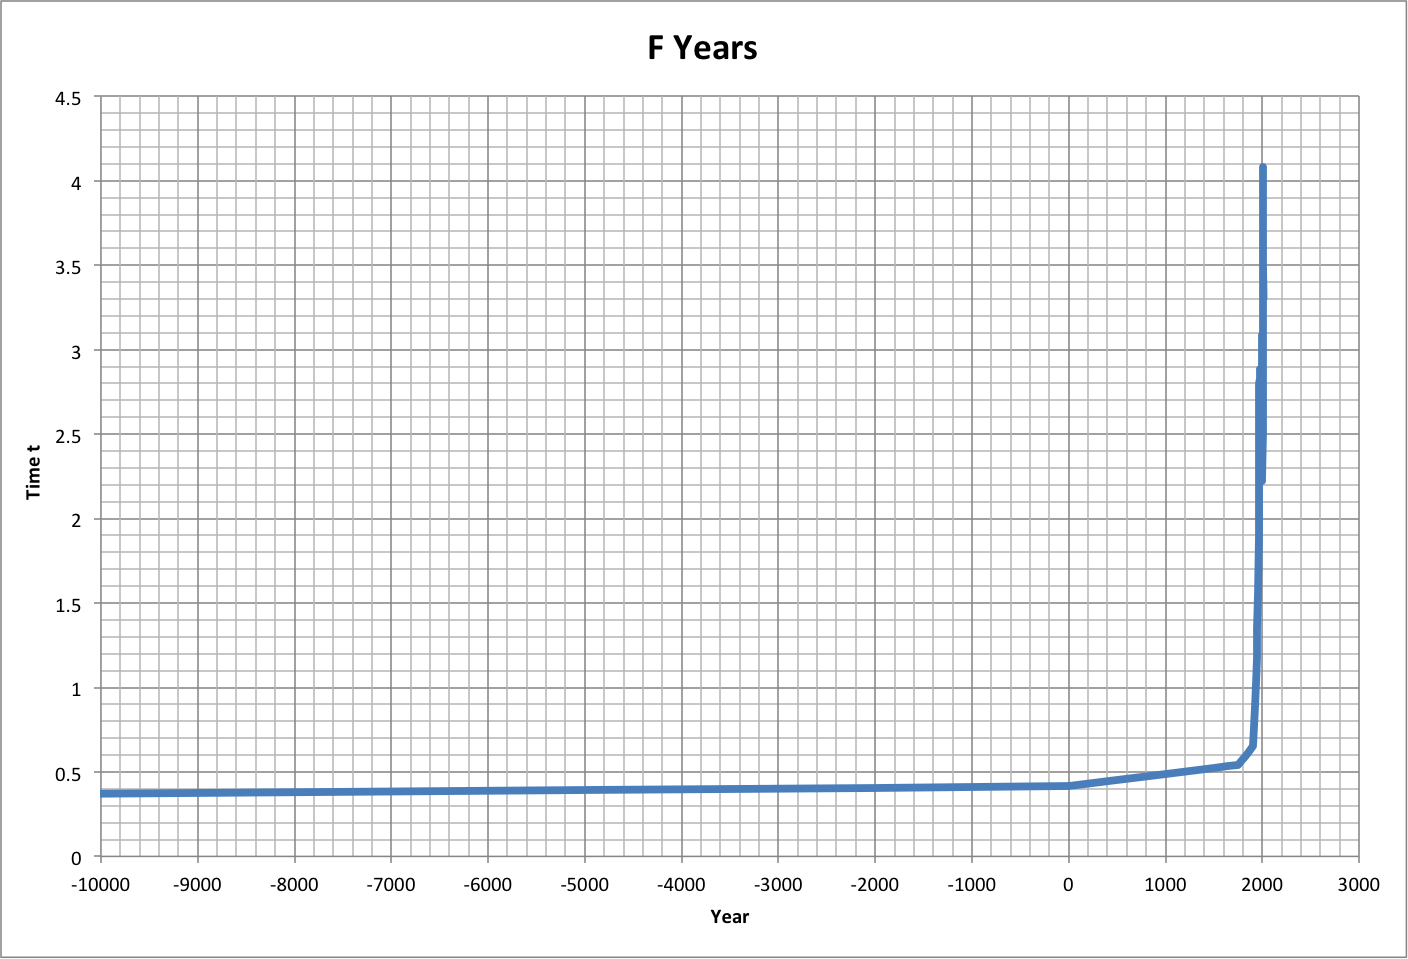
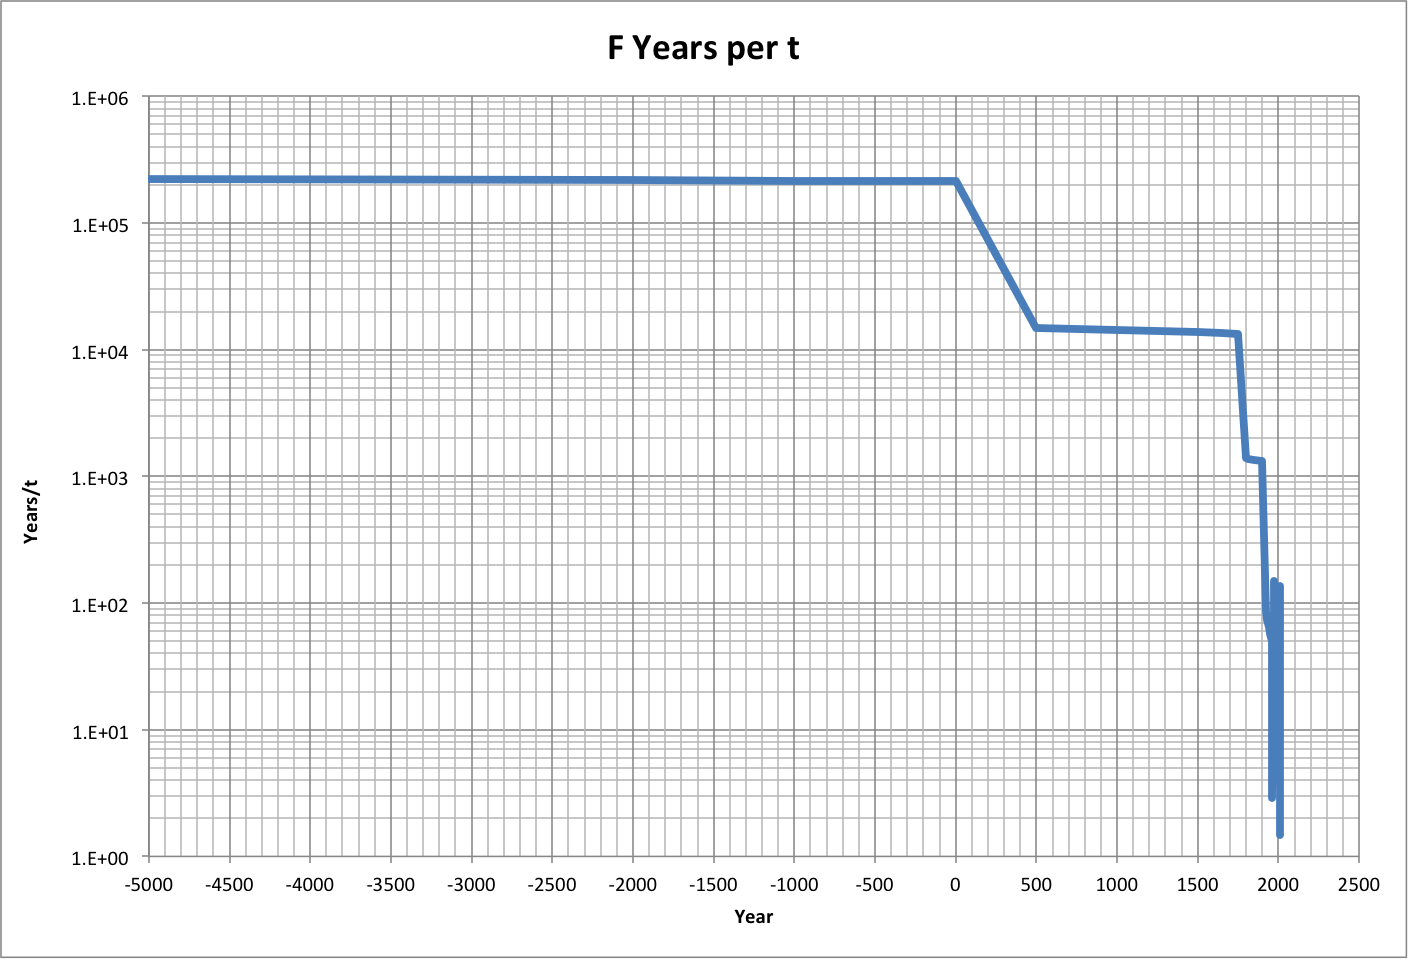
One task that humanity as a whole has been performing is increasing its consumption of ecological resources (ecological footprint) to its maximum. Based on the Half-Earth Hypothesis, this maximum is the point where population begins to decrease, with the footprint ratio f / (f + 1) equal to the Universal Multiplier U.
The following graph shows how t changed over actual time for an assumed efficiency of 0.5. Roll over the image to see a close-up. Note that the time appears to have already peaked.
For discussion, see the following related blog posts:
- Idea Explorer: Efficiency Revisited
- Land of Conscience: Disruption