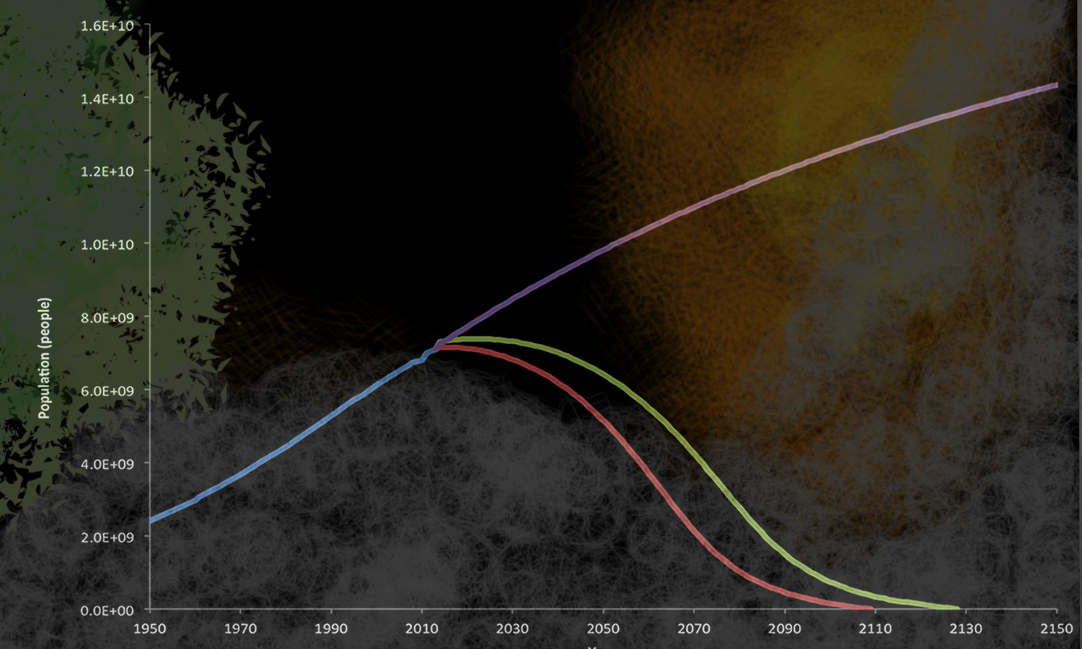
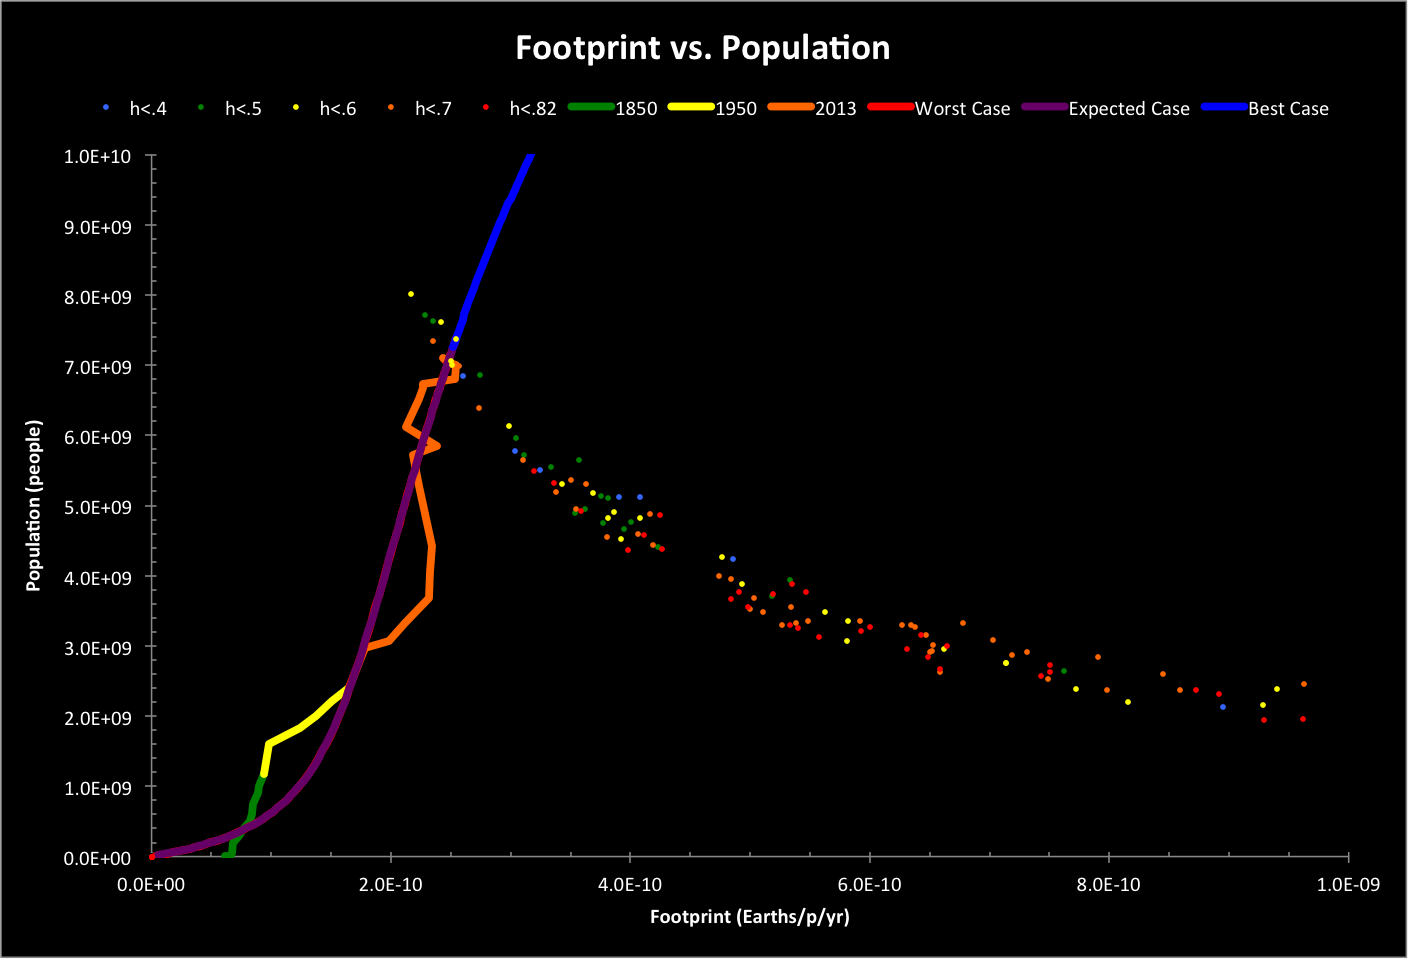
Projections into the future are based on historical trends and bracketed by "Worst case" (red) and "Best case" (purple) trajectories. An "Expected case" (green) presents a combination of several trajectories, which may be the most likely.
What is "best" for our population won't be best for the rest of the planet as Earth becomes quickly uninhabitable. Vast new resources will need to be found to fuel growth toward what may be an ultimate limit to happiness.
We are more probably near our population's peak size, limited by our depletion of the resources needed to grow. Within a decade, everything will be declining; and by early in the next century (if climate change doesn't accelerate the decline), we will be practically extinct, taking most animals and plants with us.
2014 Projections
| Variable | Worst Case |
Expected Case | Best Case |
| Population (109 people) | 7.15 | 7.31 | 7.25 |
| Life Expectancy (years) | 69 | 70 | 70 |
| Total Footprint (Earths) | 1.79 | 1.85 | 1.83 |
| Happiness | 0.66 | 0.66 | 0.66 |
| Economic Activity (1019 person-equivalents2), Annual Change | 2.25, +3% | 2.36, +8% | 2.32, +6% |
| Economic Size (1029 person-equivalents3), Annual Change | 1.07, +4% | 1.15, +12% | 1.12, +9% |
| Max. Environments (109 person-equivalents) | 8.67 | 8.21 | 8.38 |
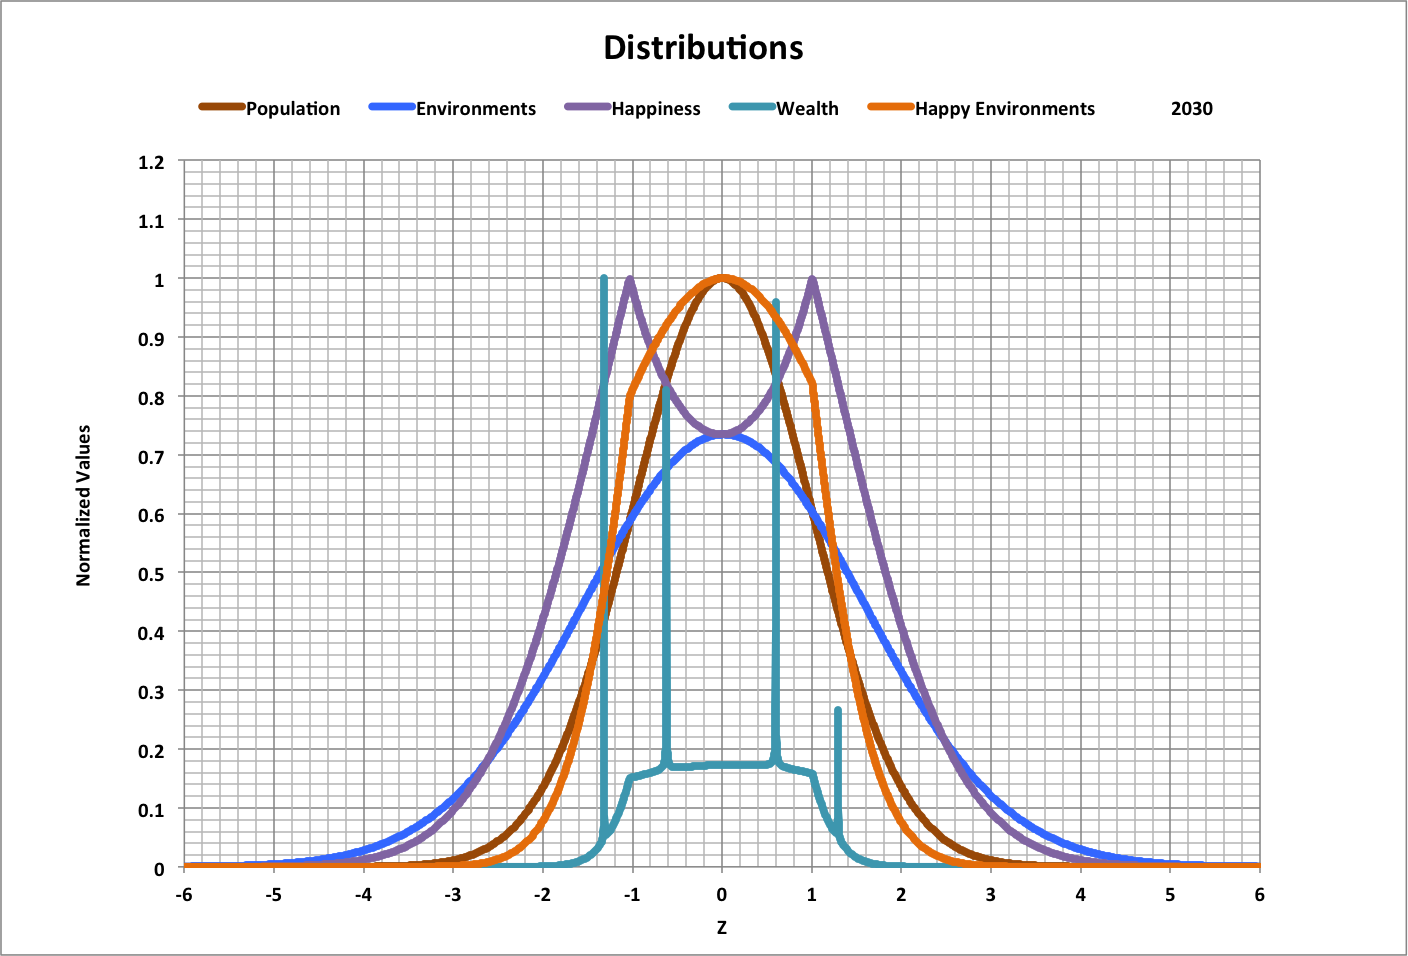
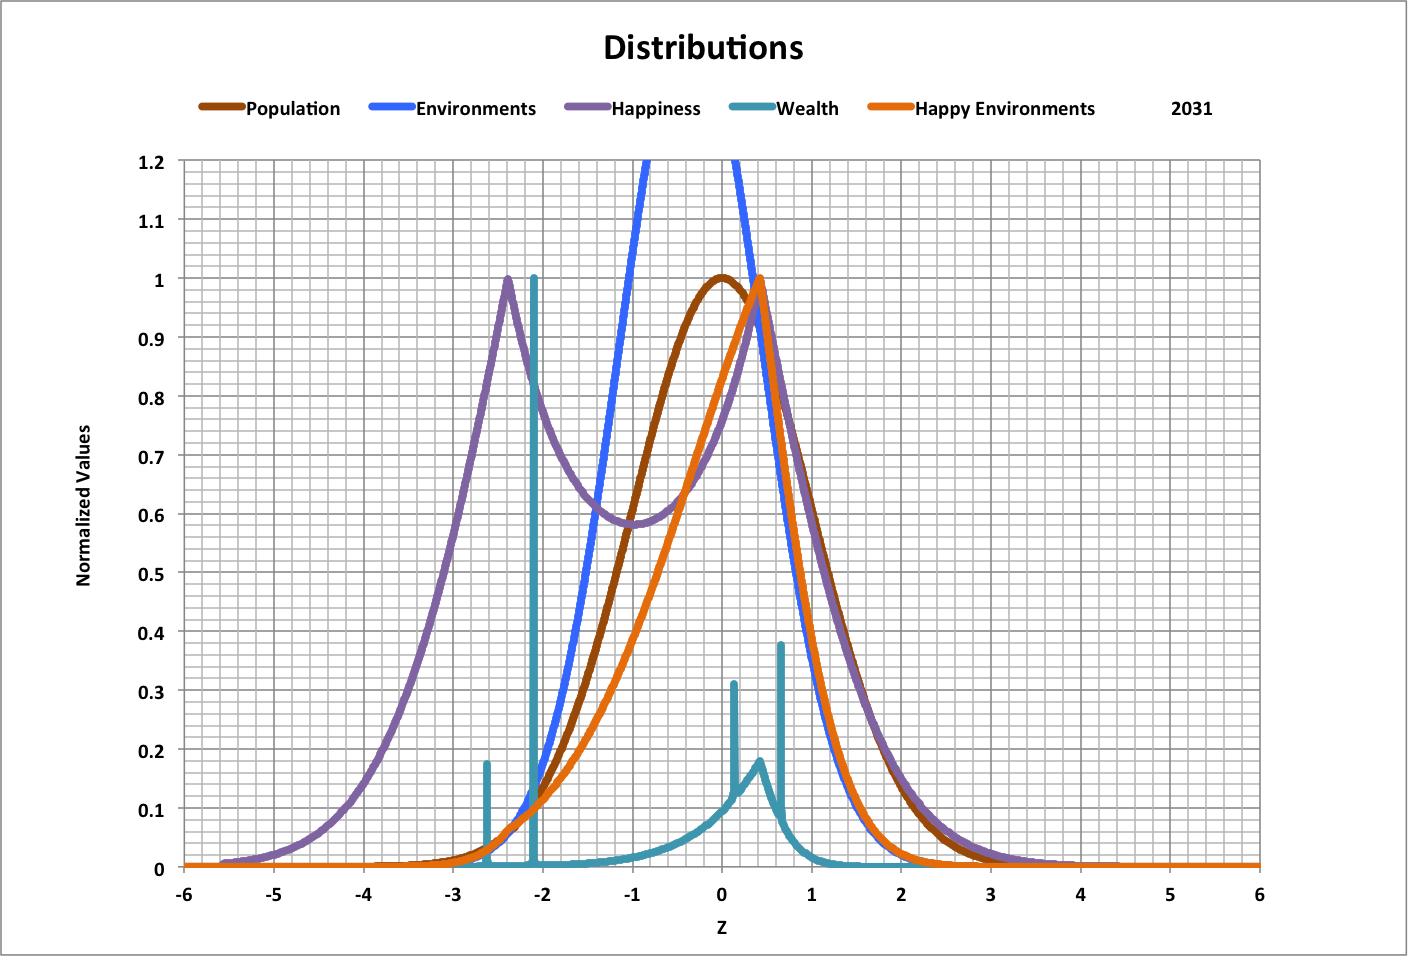
2030-2031 Distributions
| In 2030, with inhabited environments dropping along with the Living Planet Index (LPI) in the Worst case, and the total footprint from the Best case driving the LPI, population will be 6.83 billion. Happiness and the economy may be better distributed than now, as shown below. | The following year, in 2031, population will be 6.78 billion, and everything else could look very different. |
 |
 |
Simulation Results |
Based on a simulation of possible conditions ("worlds"), a limited number of options remained as of 2013. Using an estimate of how long it took historically to move from state (combination of footprint and population) to another, the following graph shows the simulated worlds that could be accessed over the 50 years following 2013. |
 |
The following graph shows the Worst, Expected, and Best case projections superimposed with the history on the simulation. Roll over the image to see a larger scale view. |
 |
See also: