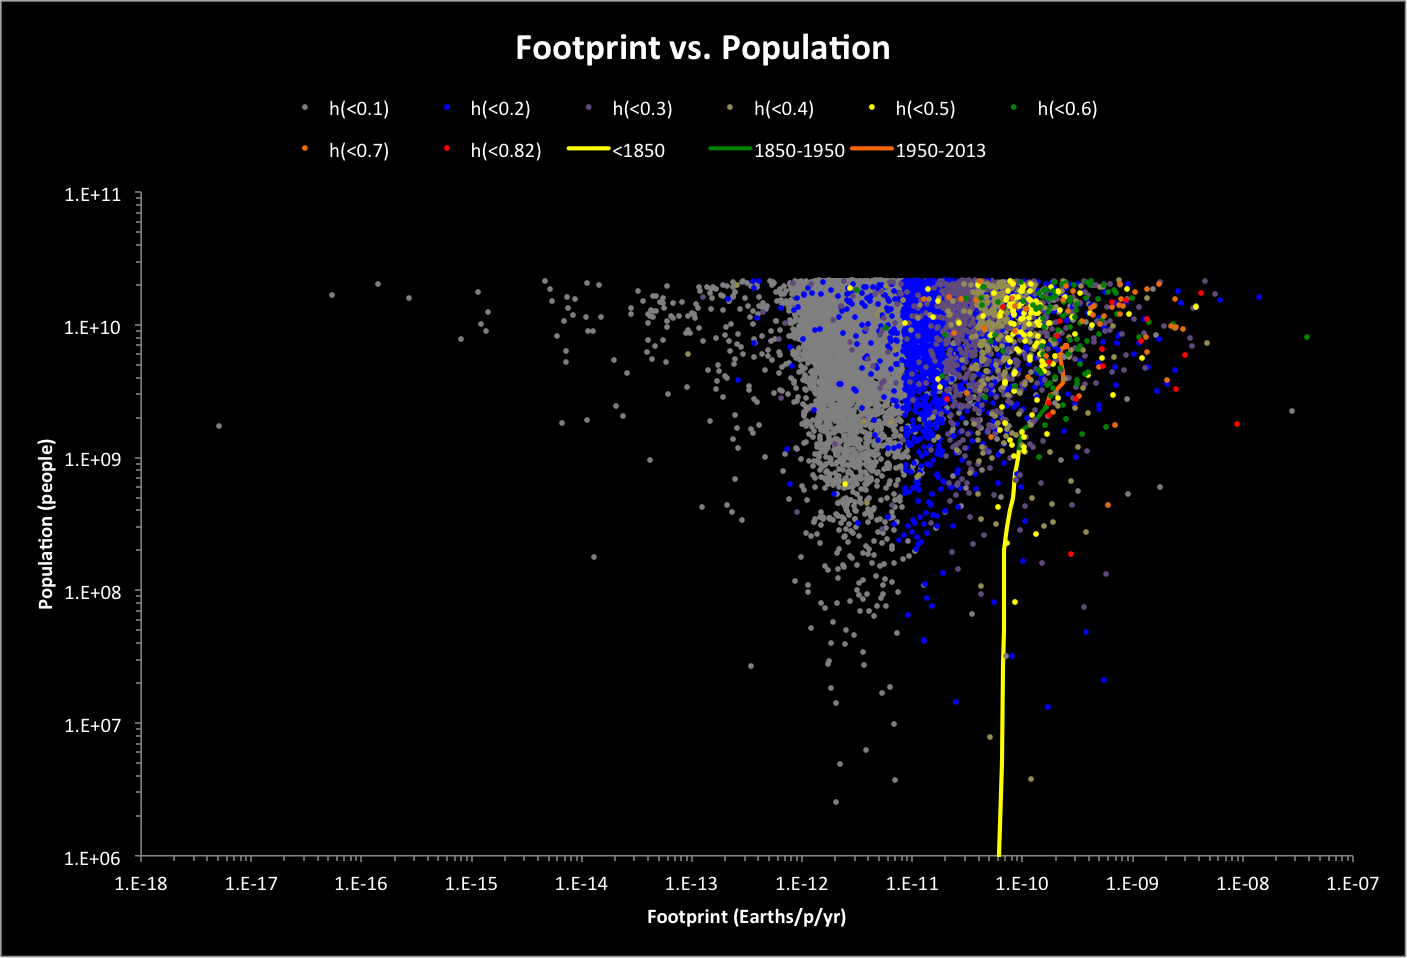
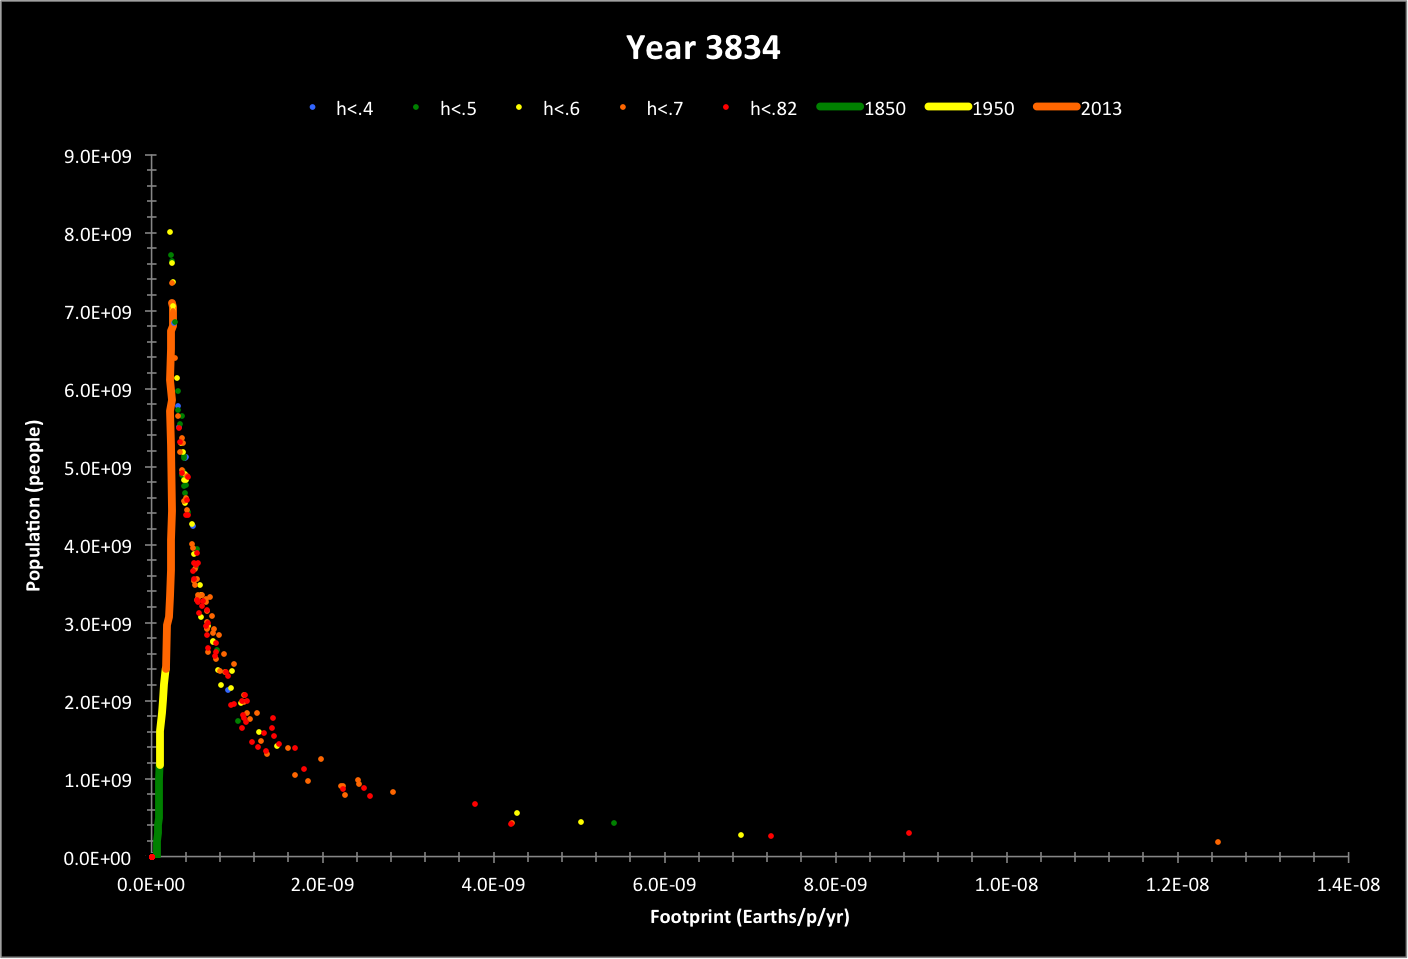
The graph above shows the results of a simulation of the Population-consumption model, where 10,000 random distributions of people and environments are evaluated for ecological footprint and happiness. Happiness h is color coded, and historical values are also plotted by the years we transitioned into each range of happiness (also color coded). Because the numbers can be extremely small or extremely large, a logarithmic scale is used for both axes.
Variable ranges are as follows:
Happiness Range: |
0 |
to | 0.82035 |
Epop/Ppop Range: |
1 |
to | 100 |
Env Mean Range: |
-3 |
to | 3 |
Env SD Range: |
0.0001 |
to | 3 |
This simulation approximates the full range of possibilities without restrictions in the consumption of ecological resources. There are, however, real limits:
- People need a minimum footprint to survive
- The number of maximum environments decreases linearly with total footprint (population times footprint)
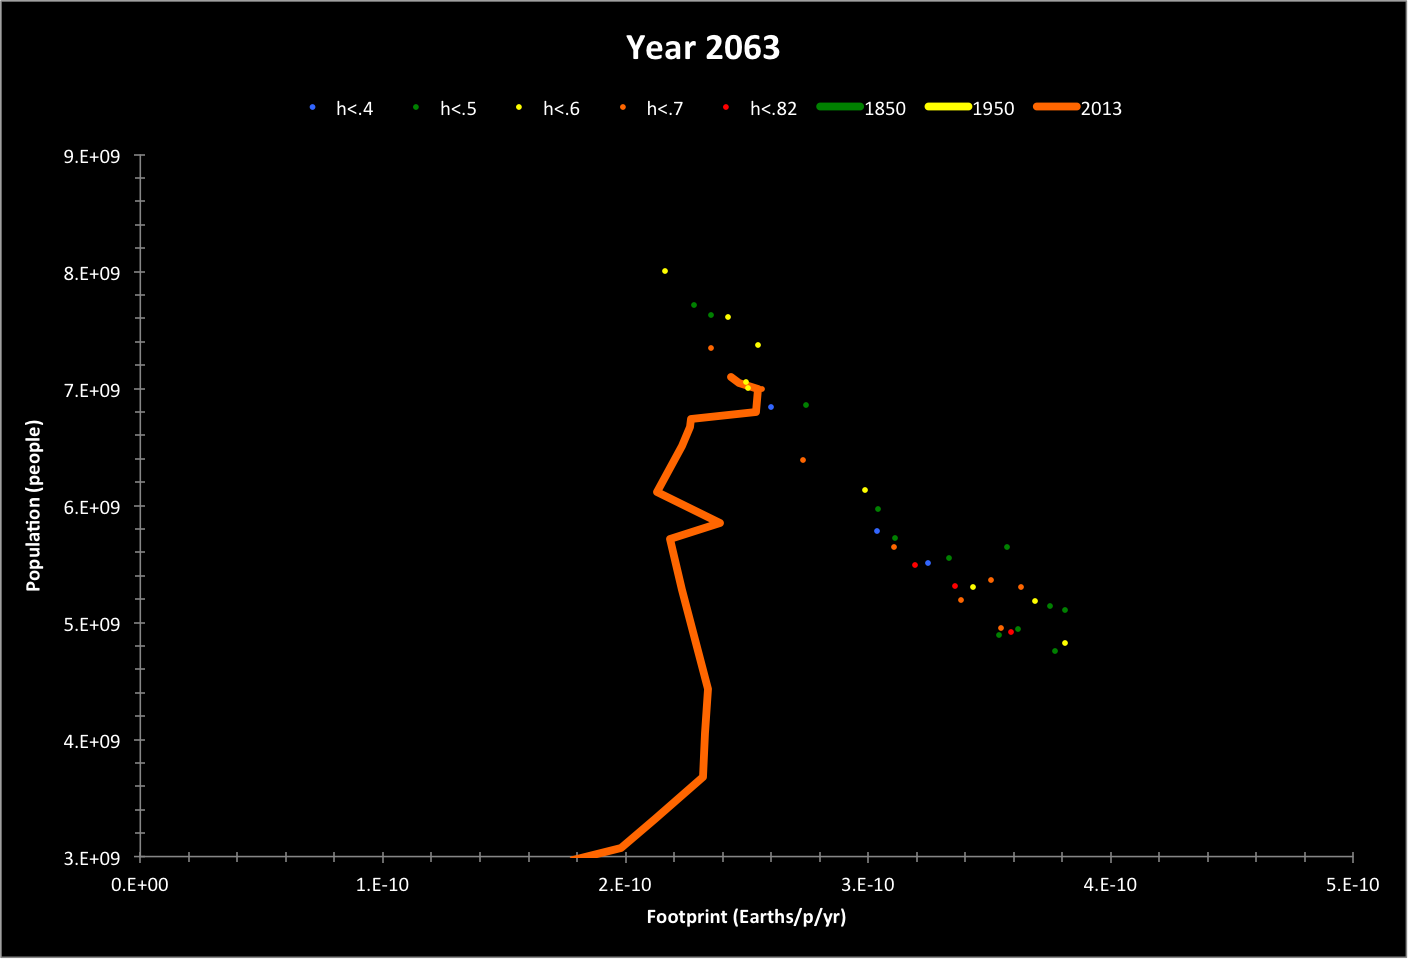
The following graph shows a closeup of results from a simulation of 7,170 data points focused on conditions that are within the range of history and potential history subject to ecological limits:
| Happiness | 0.359524249 | to | 0.820351378 |
| Epop/Ppop | 1 | to | 2.781453555 |
| Env Mean | 0 | to | 3 |
| Env SD | 1.00E-04 | to | 3 |
| Ppop | 1.00E+06 | to | 2.16E+10 |
Note that as the number of maximum environments in a given year of history falls below the number of maximum environments assocated with a data point, the data point is considered no longer valid (it is placed at the origin of the graph).
Continued on p. 2
Related pages:
Population-Consumption v4 Main Page
Better Worlds (blog post)