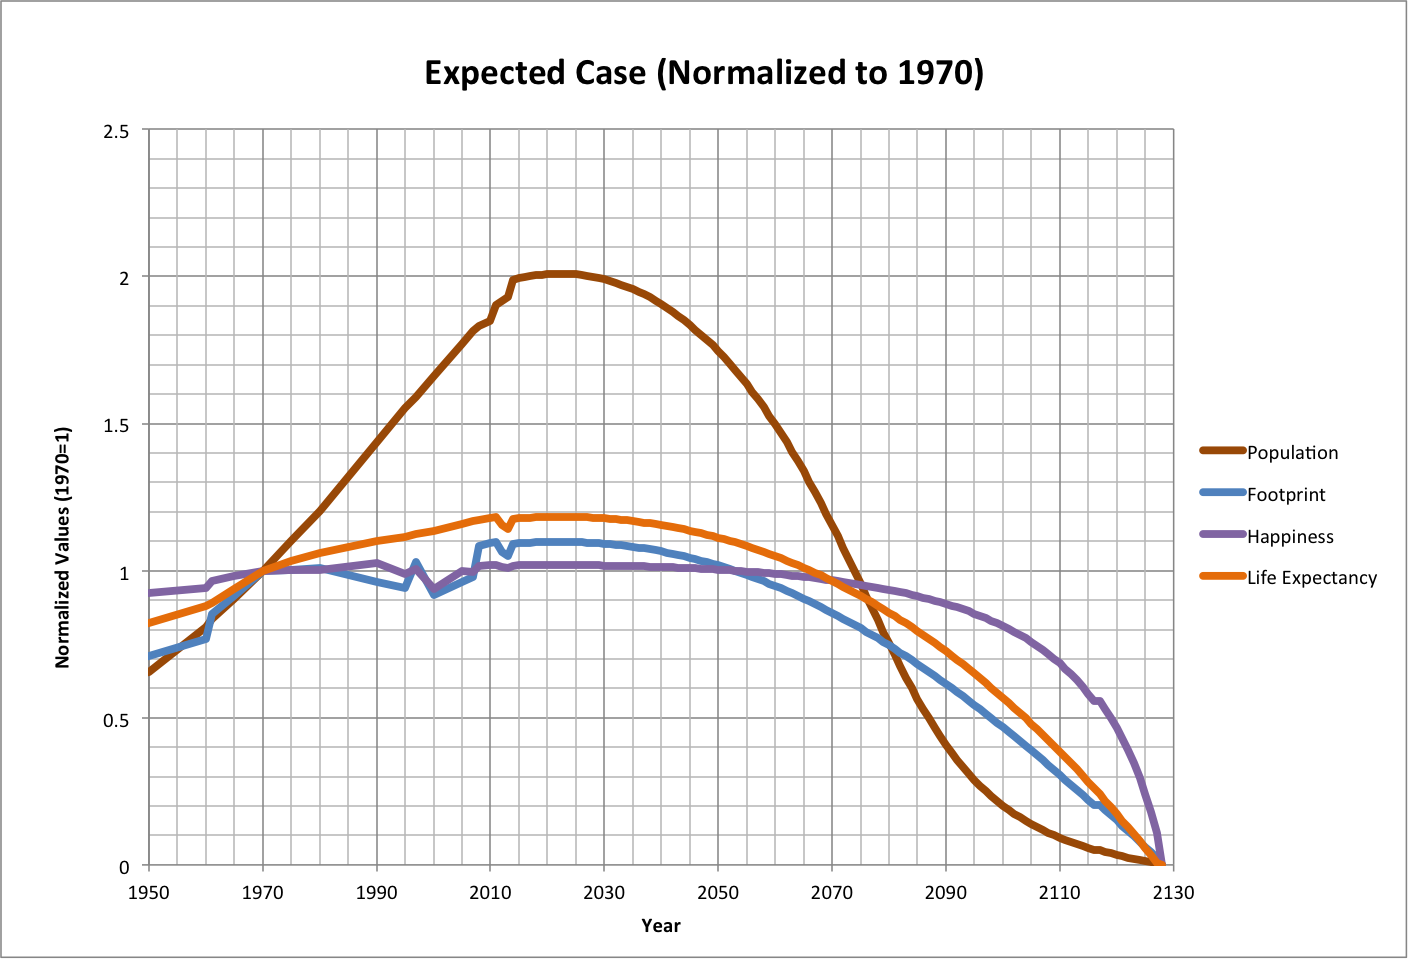
The Expected case scenario has population reaching a peak in 2022 and declining to zero by 2128.
The following graph illustrates the near-term trajectories of these variables, normalized to their values in 1970 (about the time that the total ecological footprint last enabled other species to fully provide renewable ecological resources and have enough left for their own survival).
 |
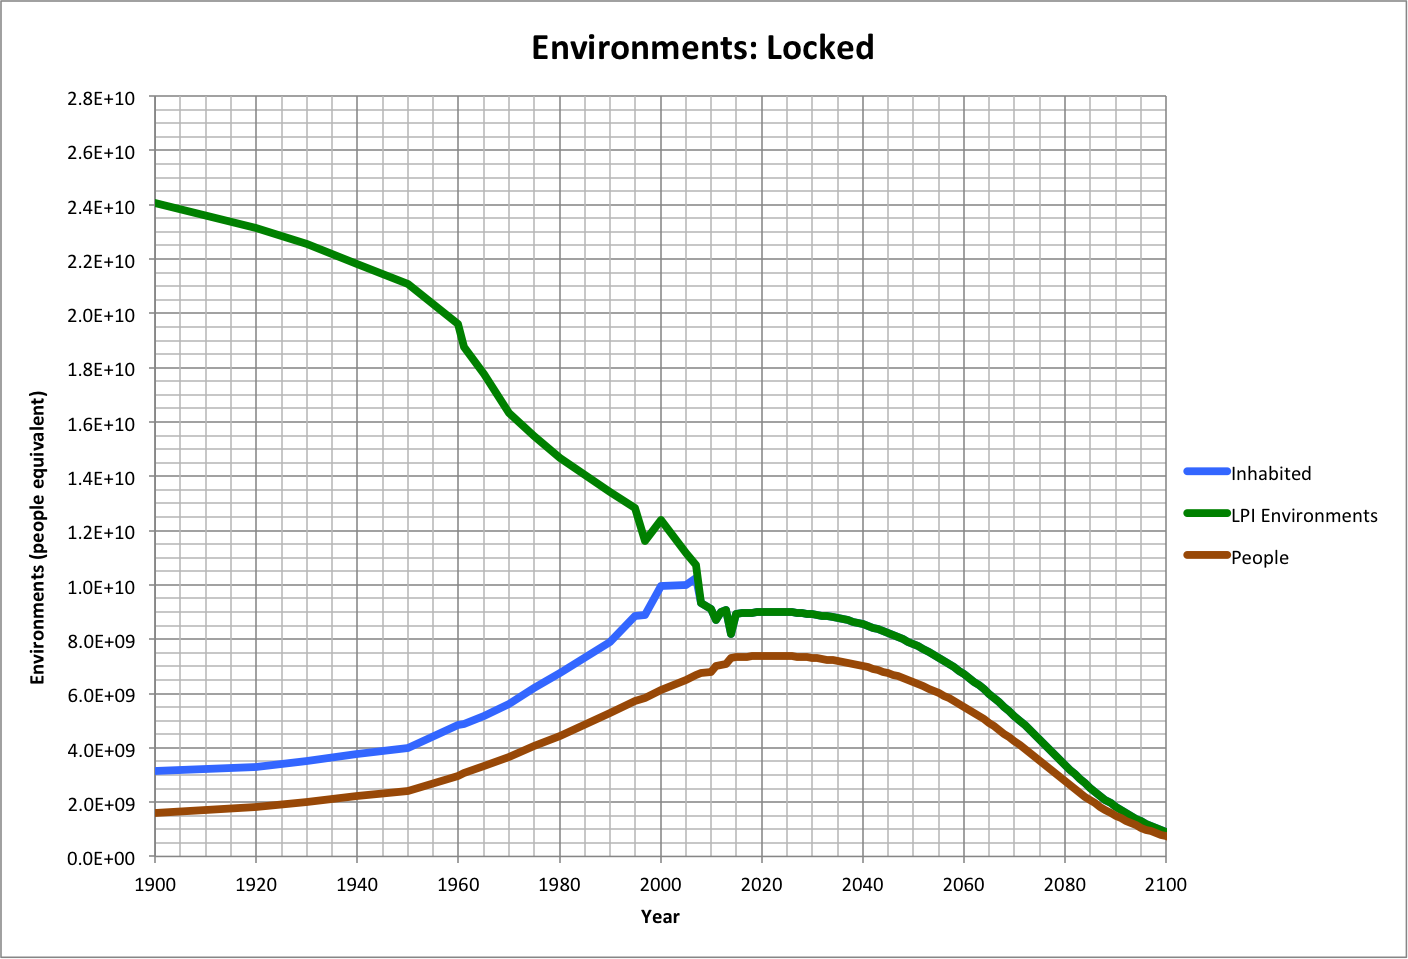
As discussed for the Worst case, the peak may be caused by the limiting of growth imposed by depleted species, leading to a "locking" of total and inhabited environments. As with the Worst case, by this year (2014), the ratio of human population to environments (Pop/Epop) will approach the maximum happiness limit (0.82), while actual happiness remains lower, perhaps due to redistribution of resources among the population since 2008, as shown in Figure B for 2014.
Figure A |
Figure B |
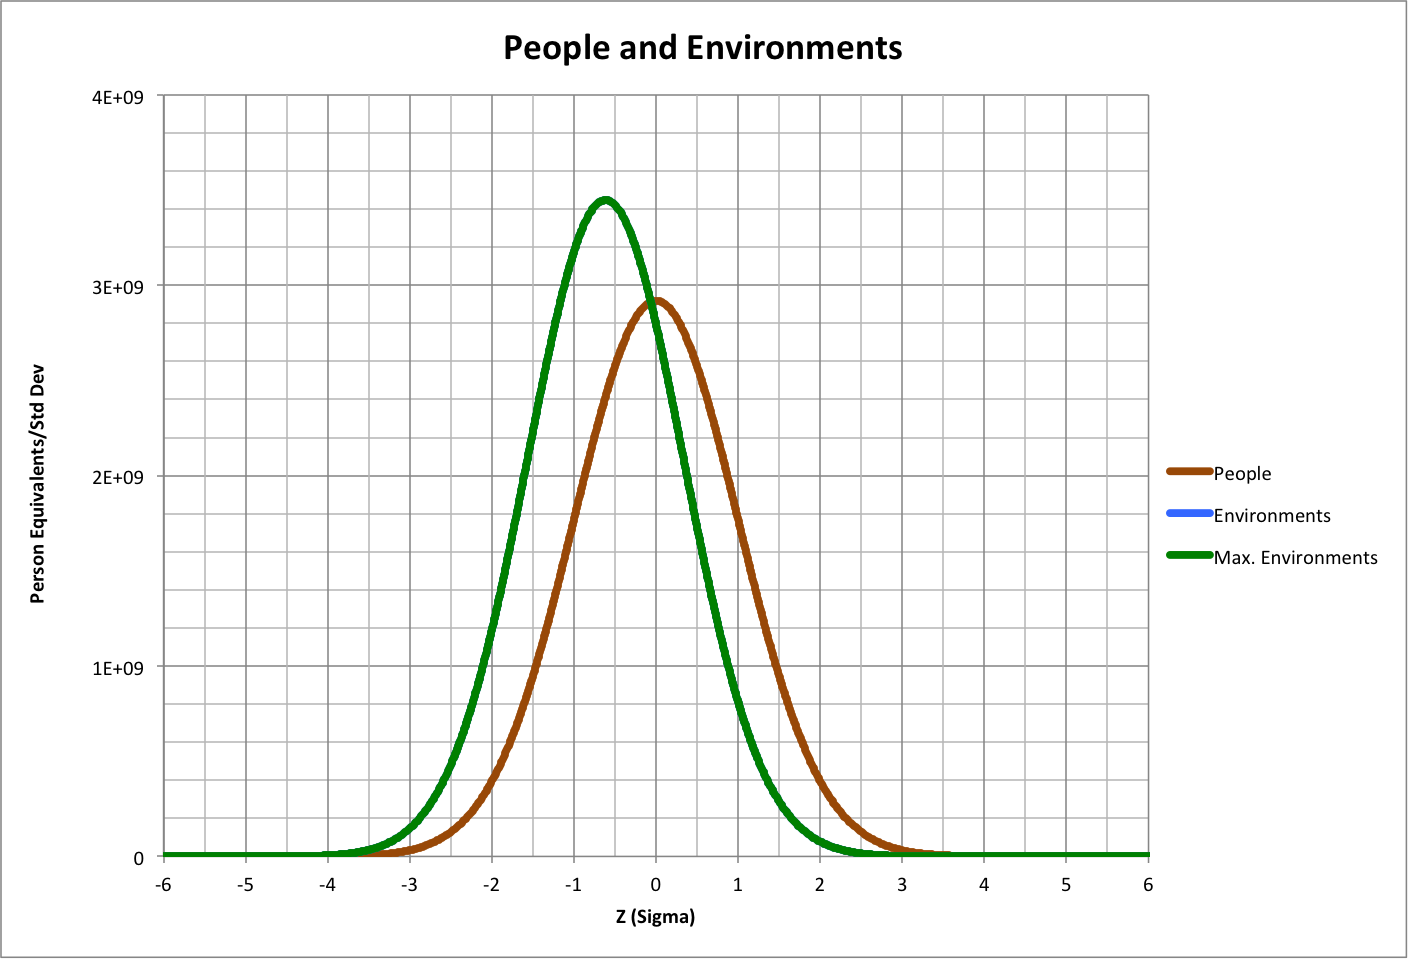
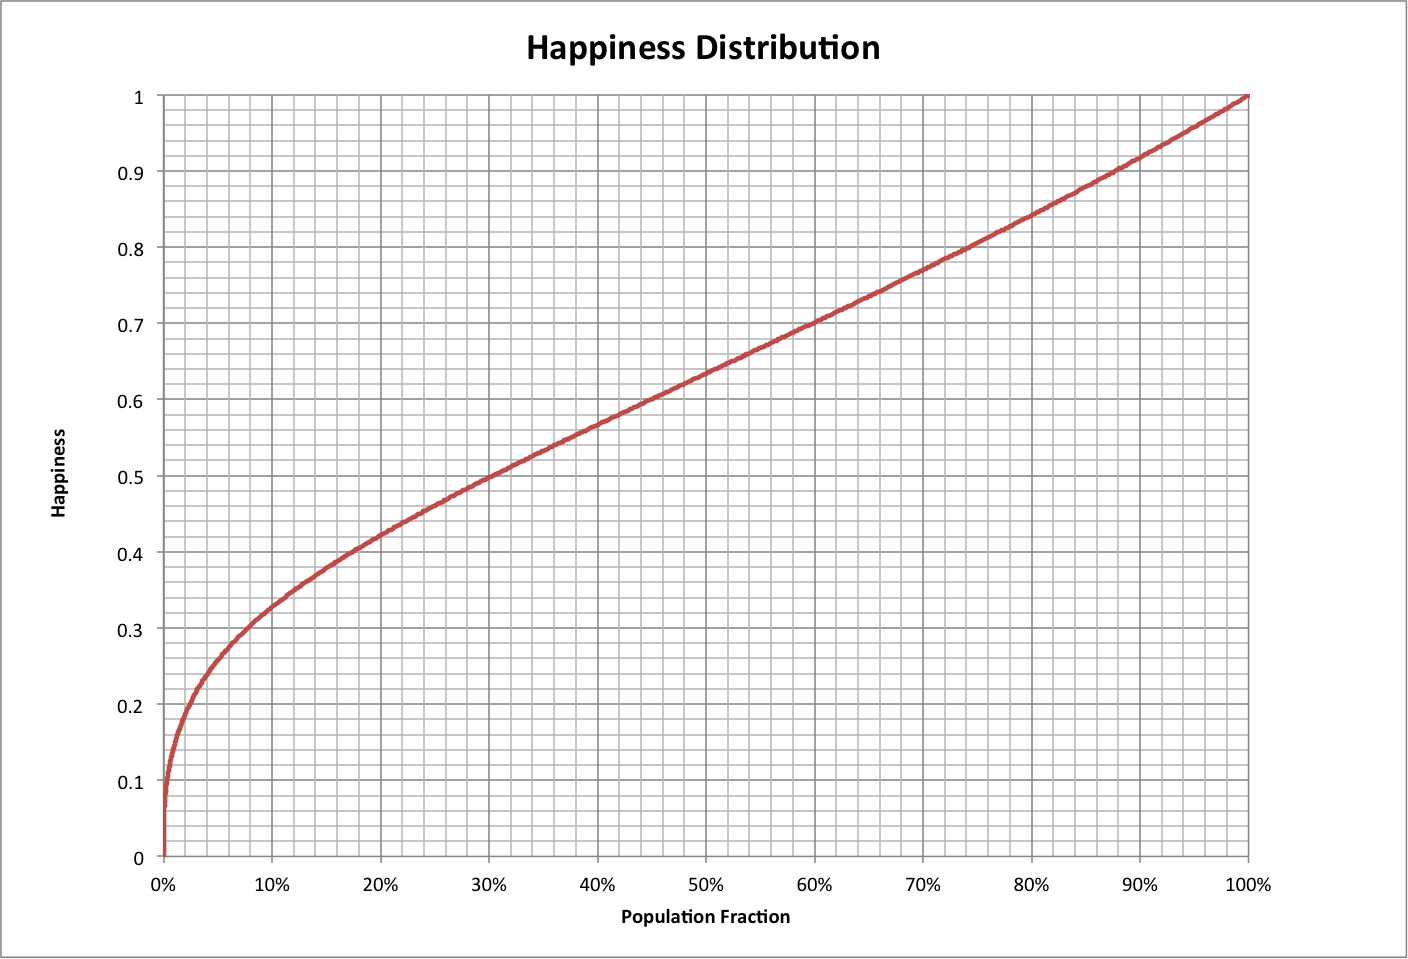 |
Figure C
See also:
Population-Consumption v4 Main Page