Consumption Drop Future
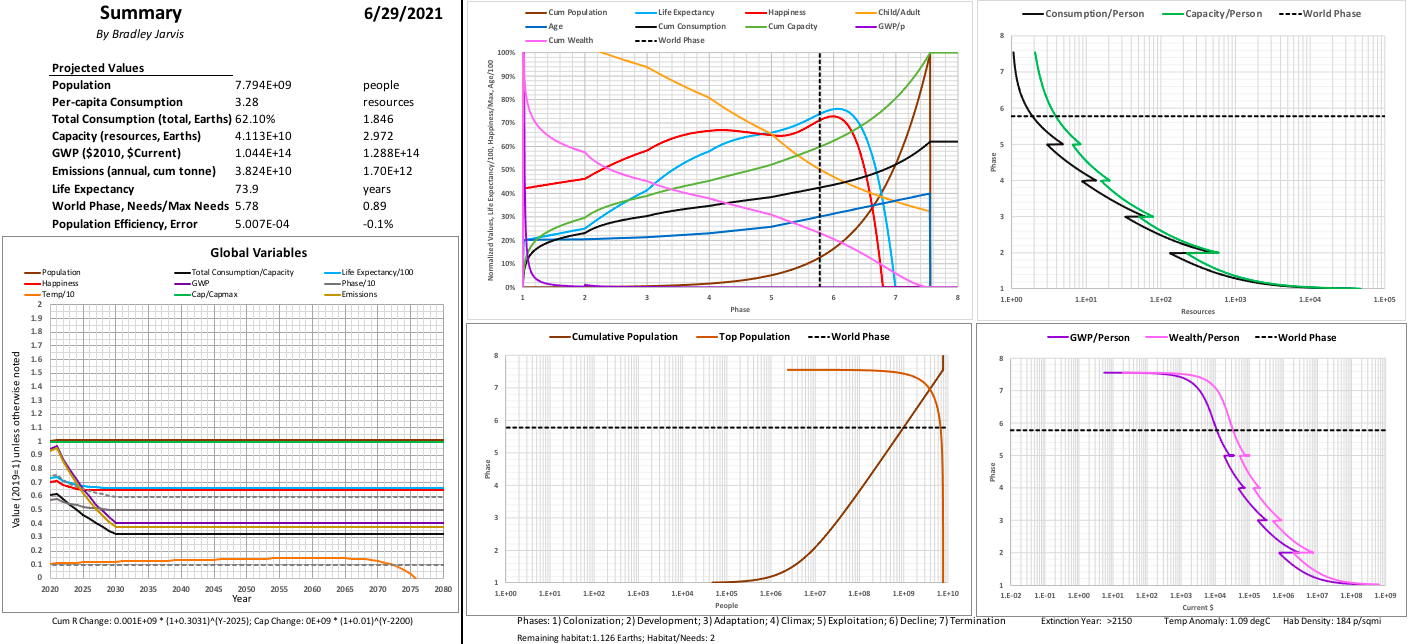
The following graphs describe an alternative future using the Timelines model. Population is held constant beginning in 2021, and per-capita consumption is reduced to only what is renewably produced by nature. Greenhouse gases are removed from the atmosphere so that global average temperature reaches a peak and declines to its pre-industrial level.
For the following summary, roll over the image to see an animation of each year from 2021-2030.
Definitions
| Population | Number of people in the world. |
| Per-capita Consumption | Average annual resources consumed by each person in the world. |
| Total Consumption | Consumption of everyone in the world (also: R). 1 Earth = resources renewably produced per year. |
| Capacity | Total resources consumed and available for consumption (including what is produced). |
| GWP | Gross World Product (economic activity) |
| Emissions | Global greenhouse gas emissions emitted, in carbon dioxide equivalent mass. Cum = cumulative amount over time. |
| Life Expectancy | Life expectancy at birth. |
| Phase | Category of behavior dependent on ratio of needs to habitat. |
| Needs | Minimum resources per year consumed to sustain population (1/person). Remainder of consumption is waste. |
| Max Needs | Needs of a maximum population that can exist with the current amount of habitat (see below). |
| Habitat | Total resources not consumed = Capacity - Total Consumption. Also: "remaining habitat." |
| Population Efficiency | Measure of population's exponential distribution as a function of phase. |
| Population Error | Fraction of habitat not accounted for with distribution of population as a function of phase. |
| Cum R Change | Emissions-equivalent resources withdrawn from atmosphere. |
| Cap Change | Change in capacity due to causes other than human activity.. |
| Cum Population | Sum of people as a function of phase. |
| Happiness | Life satisfaction (maximum = 1). |
| Child/Adult | Average children per adult in a group. |
| Age | Median age of people in a group. |
| Cum Consumption | Sum of consumption as a function of phase. |
| Cum Capacity | Sum of capacity as a function of phase. |
| GWP/p | Gross World Product per person. |
| Wealth/p | Wealth per person. |
| Cum Wealth | Sum of wealth as a function of phase. |
| Extinction Year | Projected year that population equals zero. |
| Temp Anomaly | Difference between global average temperature and the global average temperature in 1805. |
| Hab Density | People per unit of estimated habitat area. |
See also:
| Changes(Phase) 2021-2030 | Changes in global variables from 2021 to 2030 by phase. |
Related links:
- Expected future and current simulation (Patreon.com)
- Requirements Planning (Patreon.com)
- Waste Reduction (Patreon.com)