Limit-Seeking Case
Note that this page was updated on 10/5/2015.
The following graph shows normalized values for key variables based on limit-seeking with historical parameters:
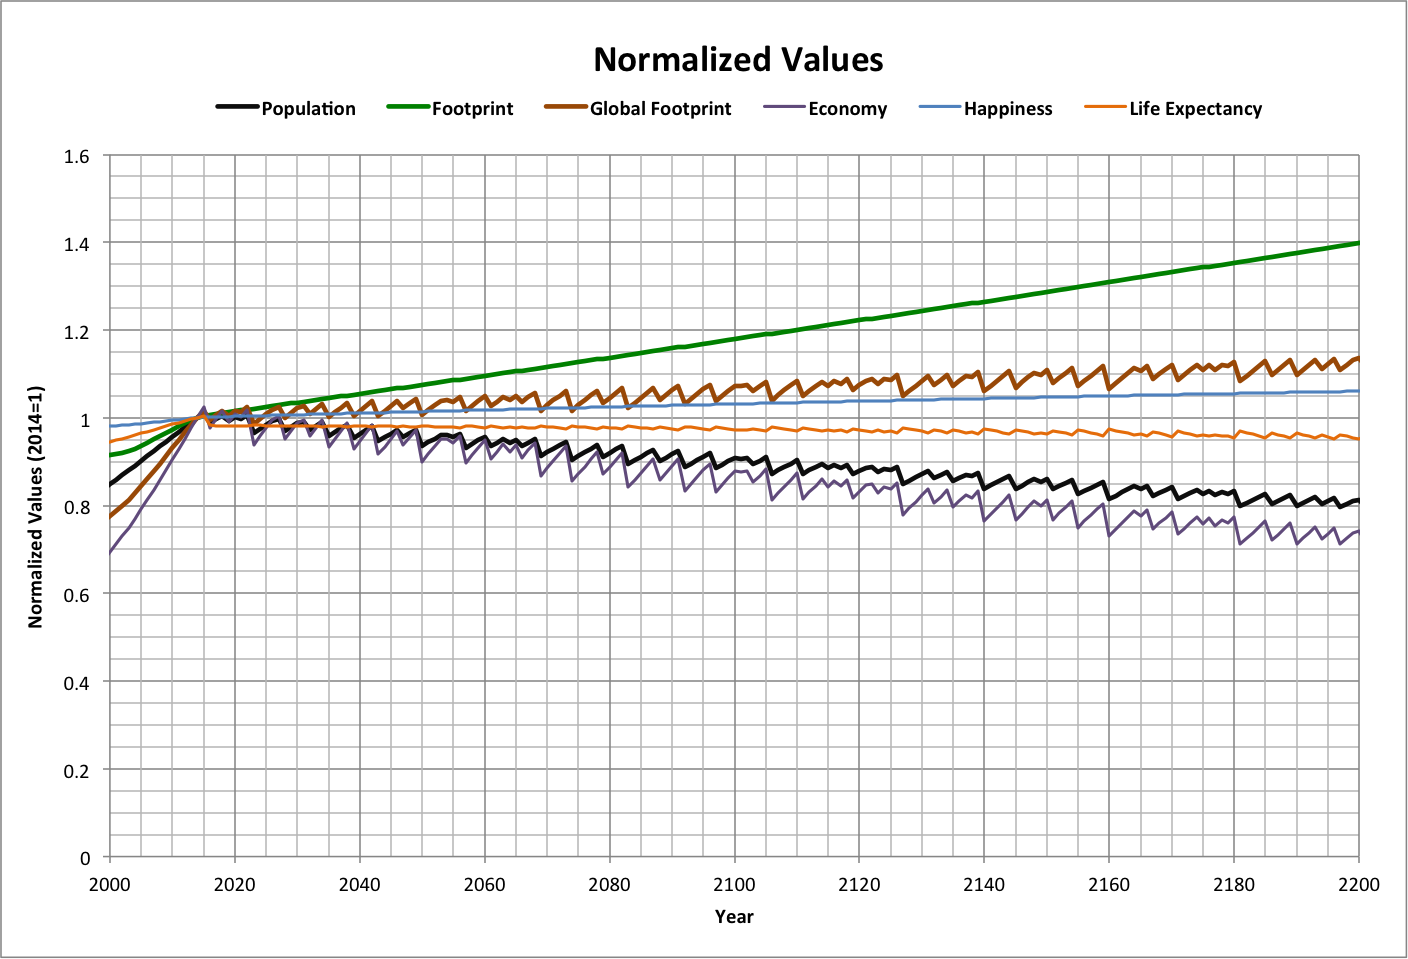
This case uses the following assumptions:
| Values | Conditions and Descriptions |
| Start Year = 2015 |
|
Fprog = ( Fyear - Fyear-1) / ( Flimityear-1 - Fyear-1) Fprogpref = A * Feyear-1 |
|
Pprog = ( Pyear - Pyear-1) / ( Plimityear-1 - Pyear-1) Pprogpref = B1 * Feyear-1B2 |
|
| ( Pyear - Pyear-1) / Pyear-1 <= Maximum [ ( Pyear - Pyear-1) / Pyear-1]year = 1950 to 2015 |
|
| Total Resources = FeTotalyear = Rrate * (year - year0) + FeTotal0 |
|
| FeMinadj = FeMinproj - [ FeTotalyear - (Feproj + 2 FeMinproj ) ] |
|
Fadj = Fmin * ( FeTotalyear - 2 * FeMinadj ) / Feminadj |
|
Pyear = Pyear-1+ Pdelta
|
|
| Fyear = Fyear-1+ Fdelta |
|
| Economy = 3.57763284972246E-18 * ( P * h )2 |
|
| L = 1.74359E-06 * Fe4 + -0.000292725 * Fe3 + 0.01679366 * Fe2 - 0.314351519 |
|
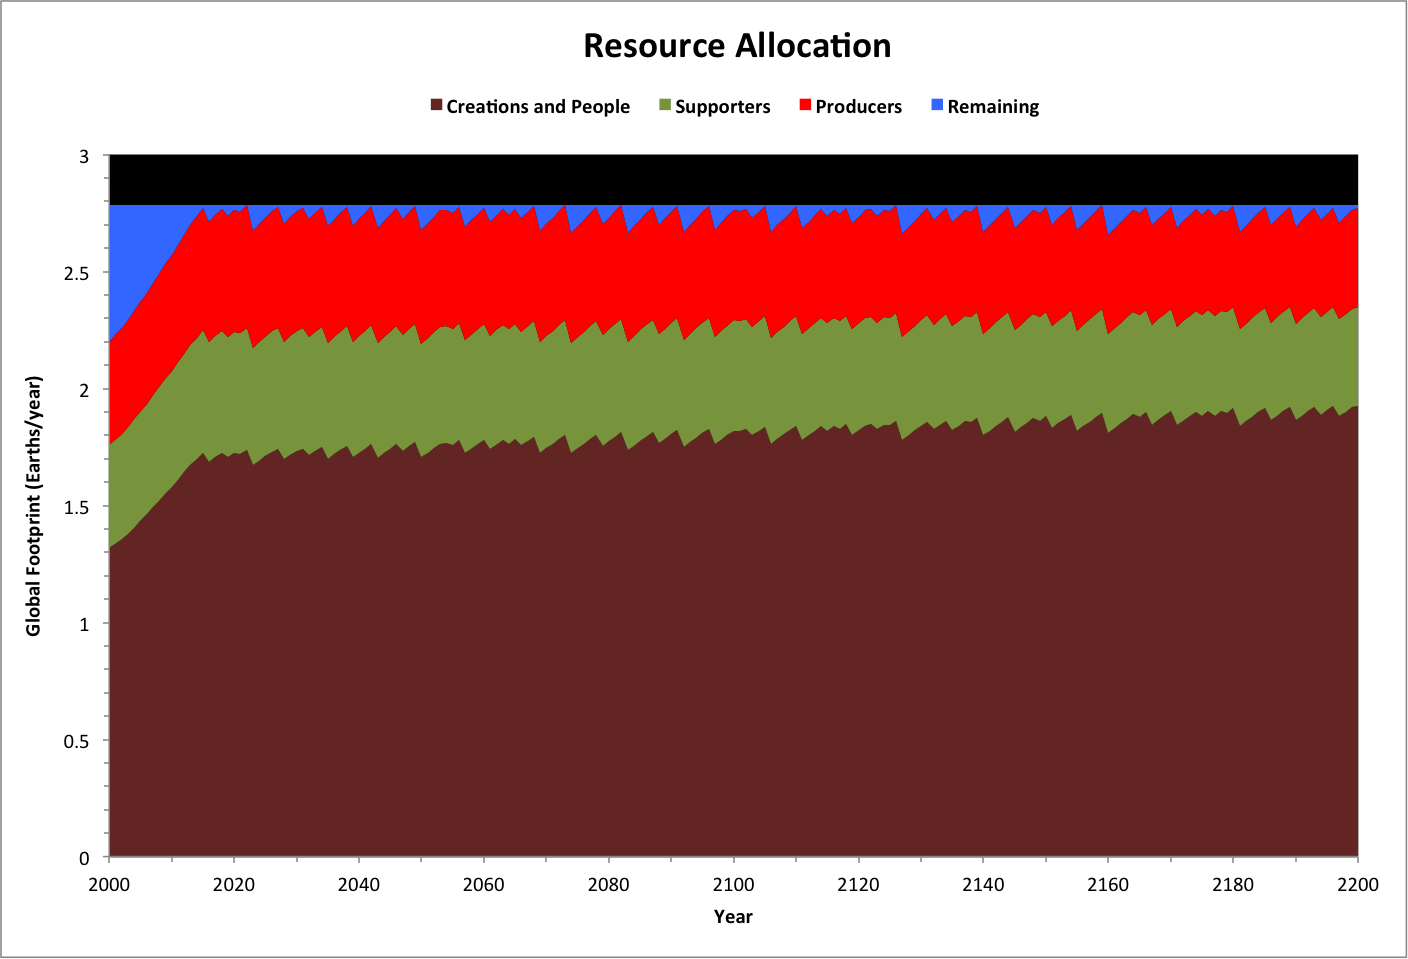
The allocation of resources is shown in the following graph, where:
- Creations and People together use Fe resources
- Supporters use Femin resources
- Producers use Femin resources
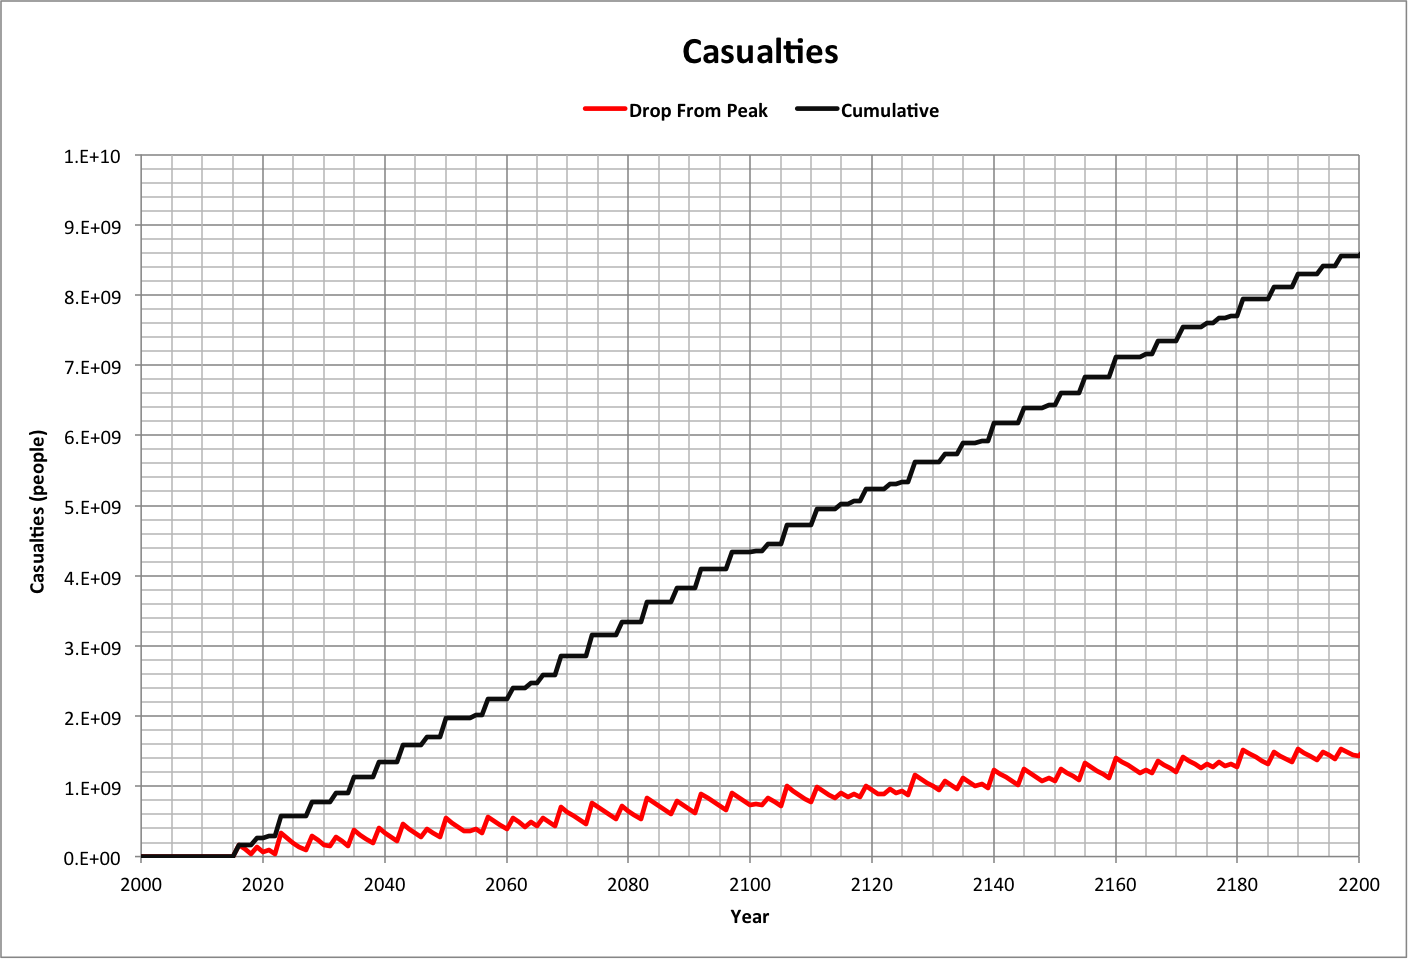
The following graph plots casualties over time, using two ways of estimating them. Drop From Peak is the difference between the peak (maximum) population and the population calculated for a given year. Cumulative adds up all negative changes in population. These represent low and high estimates, respectively.
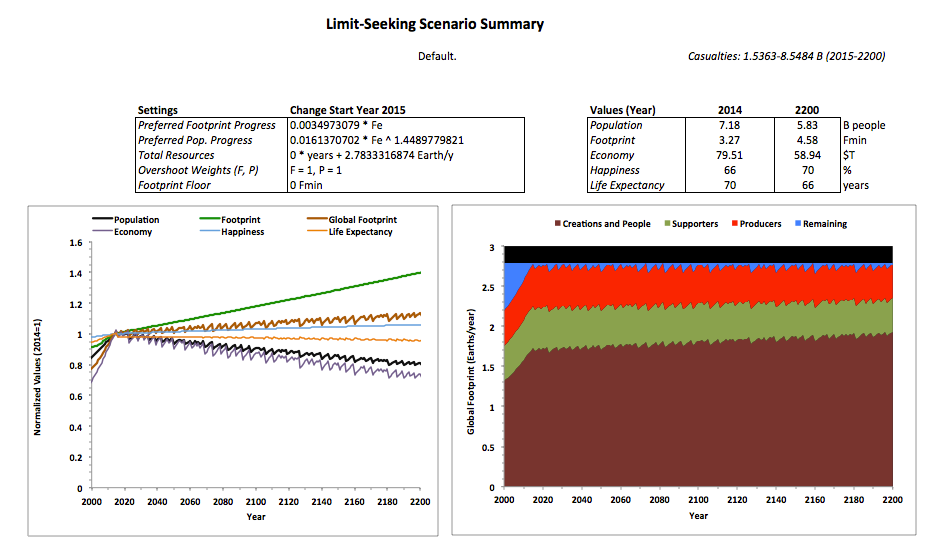
This case is summarized in the following report, which is used in other related cases:
For a discussion, see the blog post "Two Stories."