Happiness, Longevity, and Population
For each point in the sample, a random value is chosen for population, and longevity calculated based on a randomly selected growth rate (annual change in the sum of global ecological footprint and twice the minimum global footprint - population times minimum footprint per person Fmin). If longevity is less than zero, then the population is recalculated for a longevity of zero.
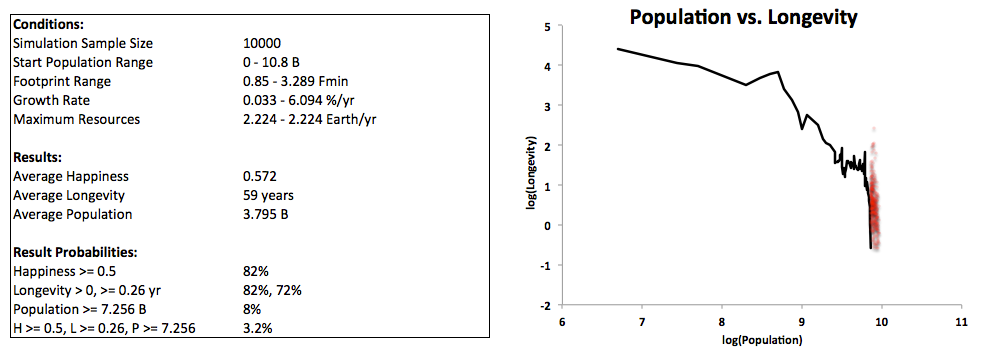
The following graph displays population vs. longevity (using base-10 logarithm scales) for all options (data points) with longevity greater than 0.01 year. The red line represents historical data, with time progressing from left to right and years 5000 BC to 2015 AD.
Roll over this and the following graphs for related summaries of the data.
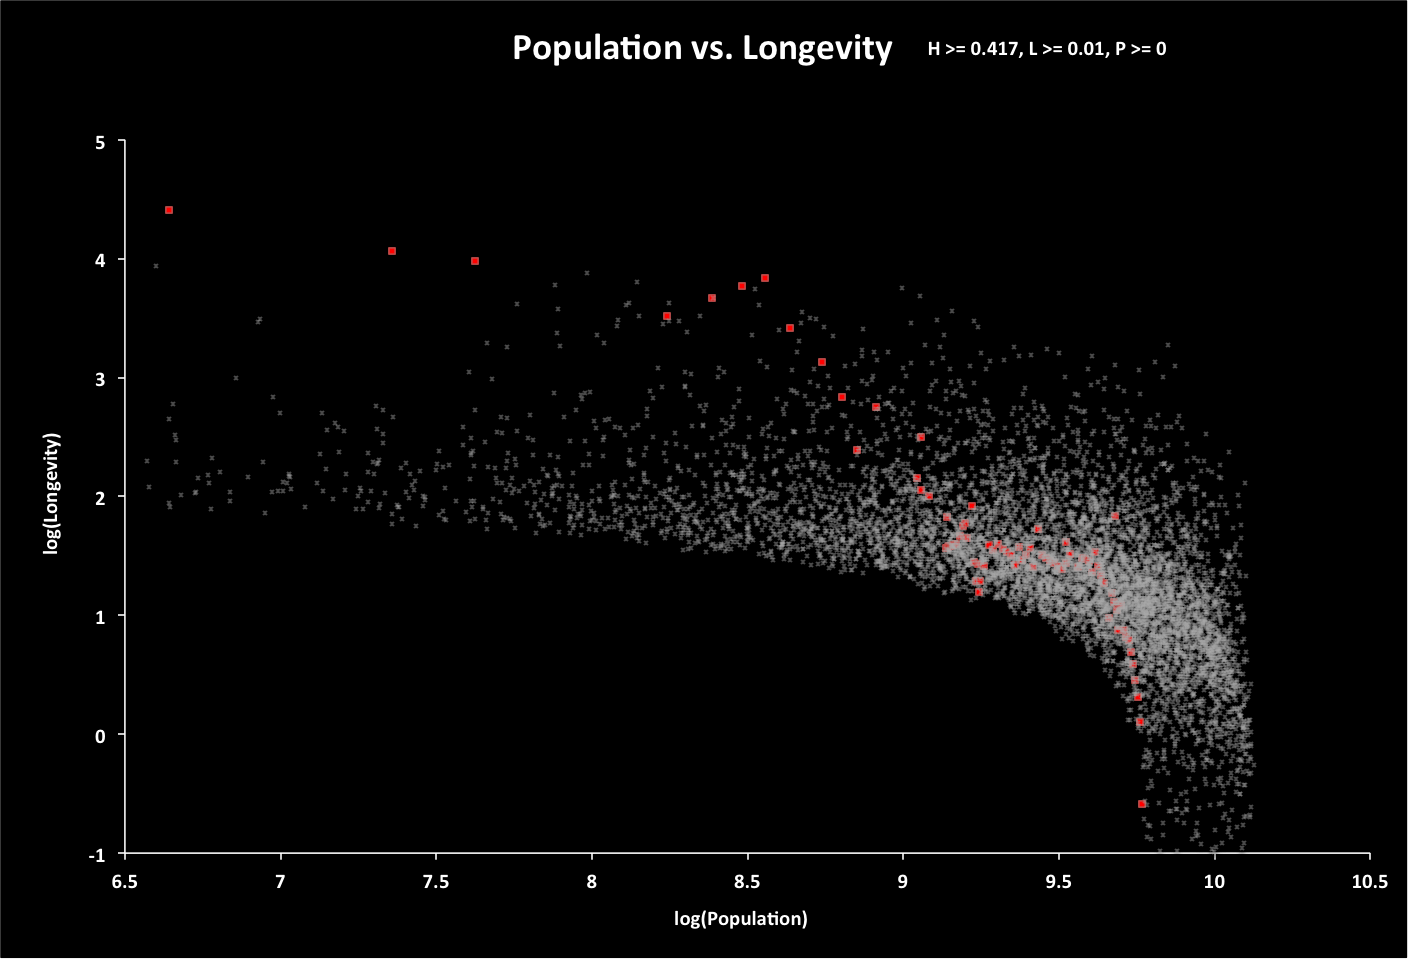
Click for animated GIF indicating happiness as height above the graph.
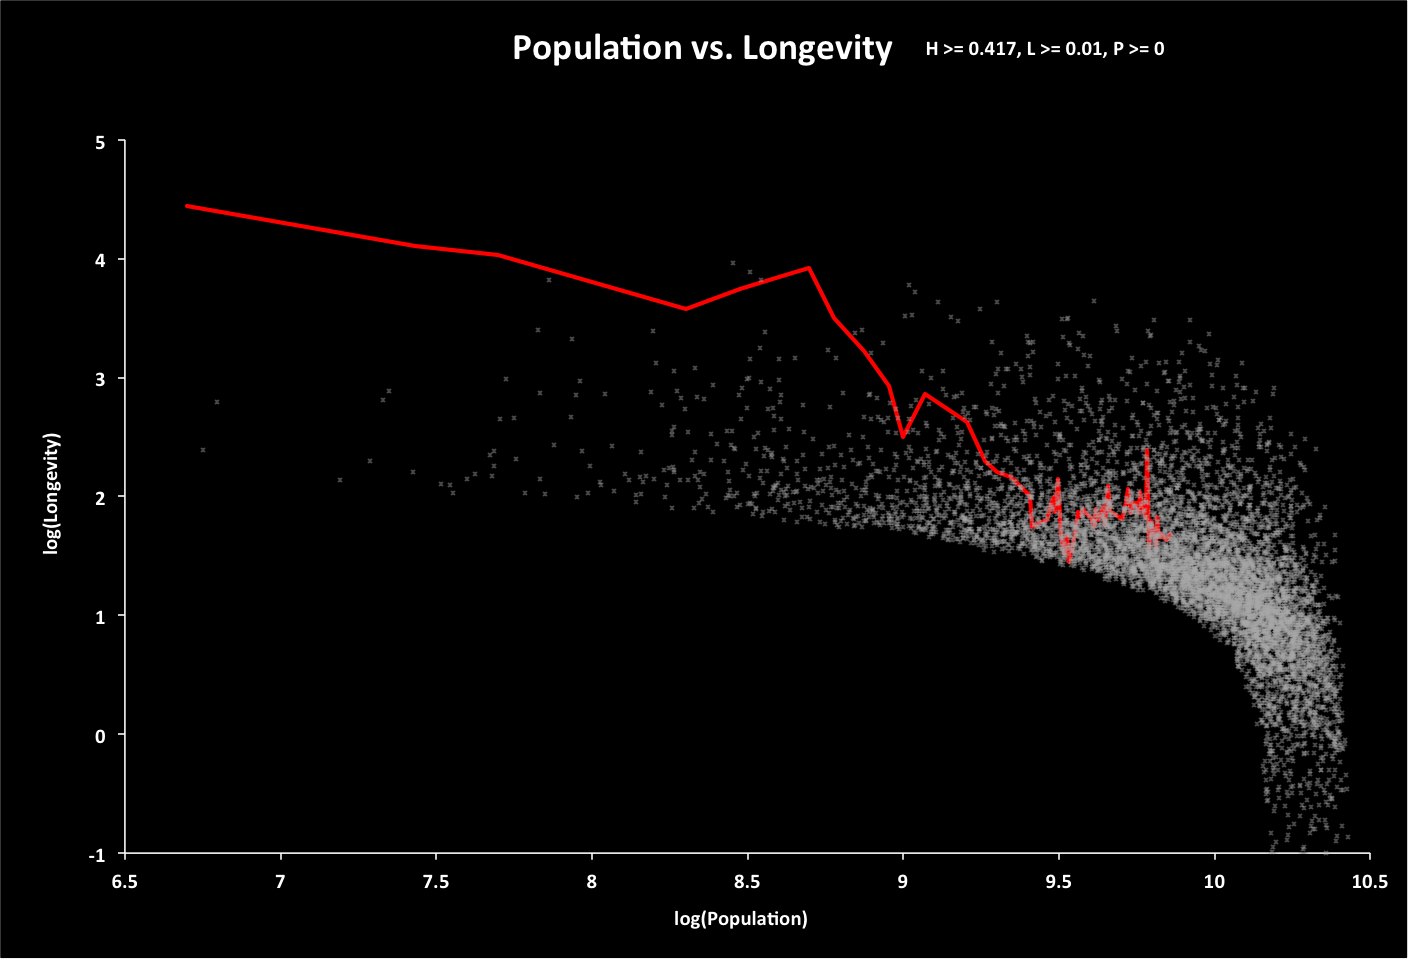
The following graph shows all options if the total resources are twice what is expected. Historical longevities have been adjusted to account for this.
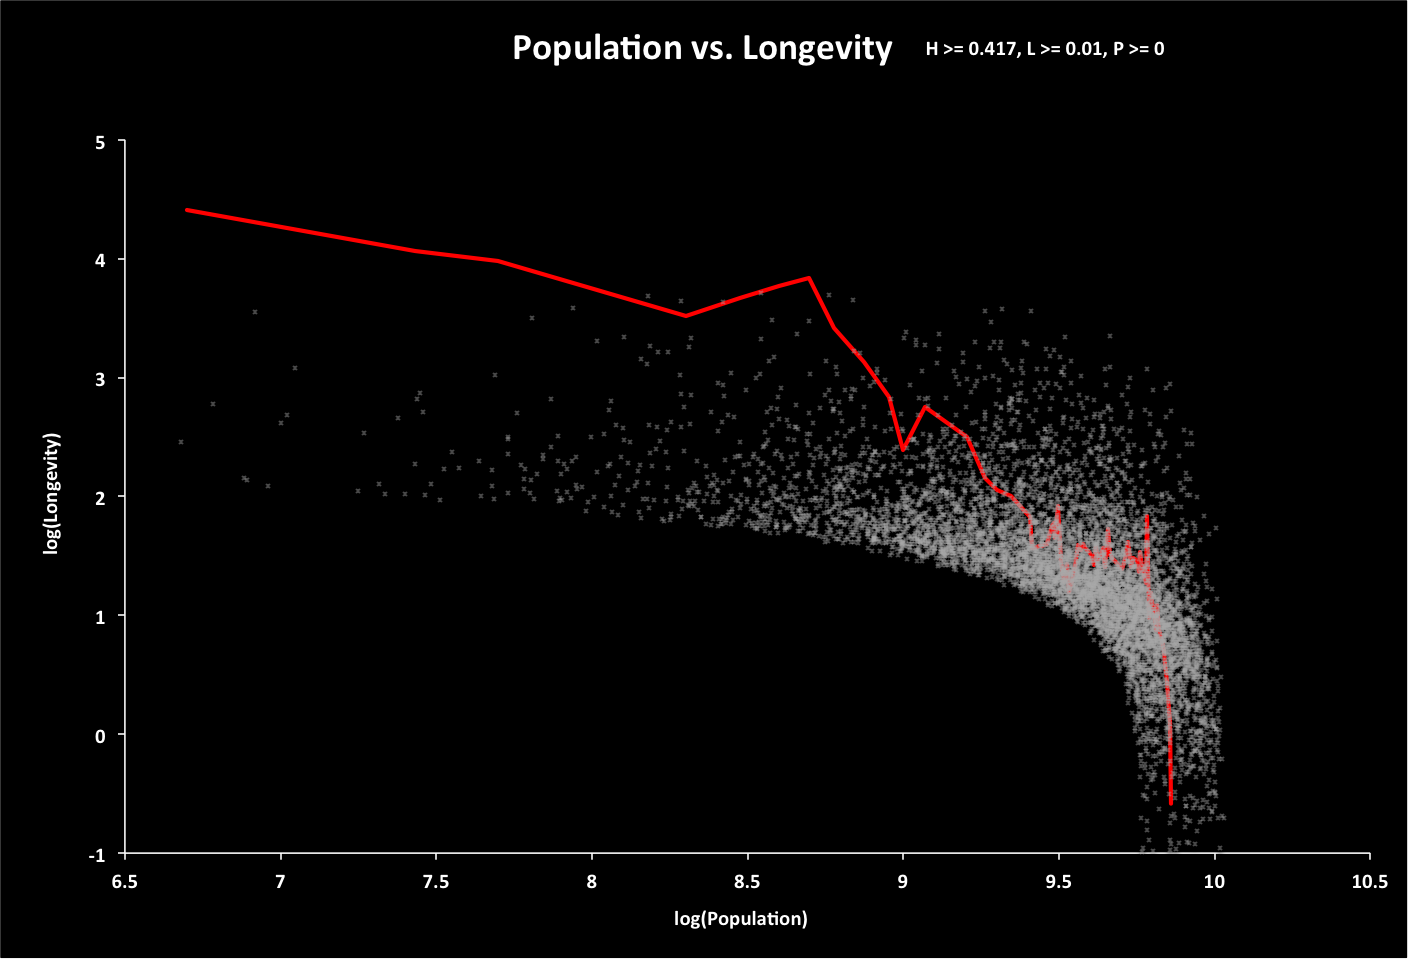
The following graph shows the options with expected resources and 30 years of global warming.
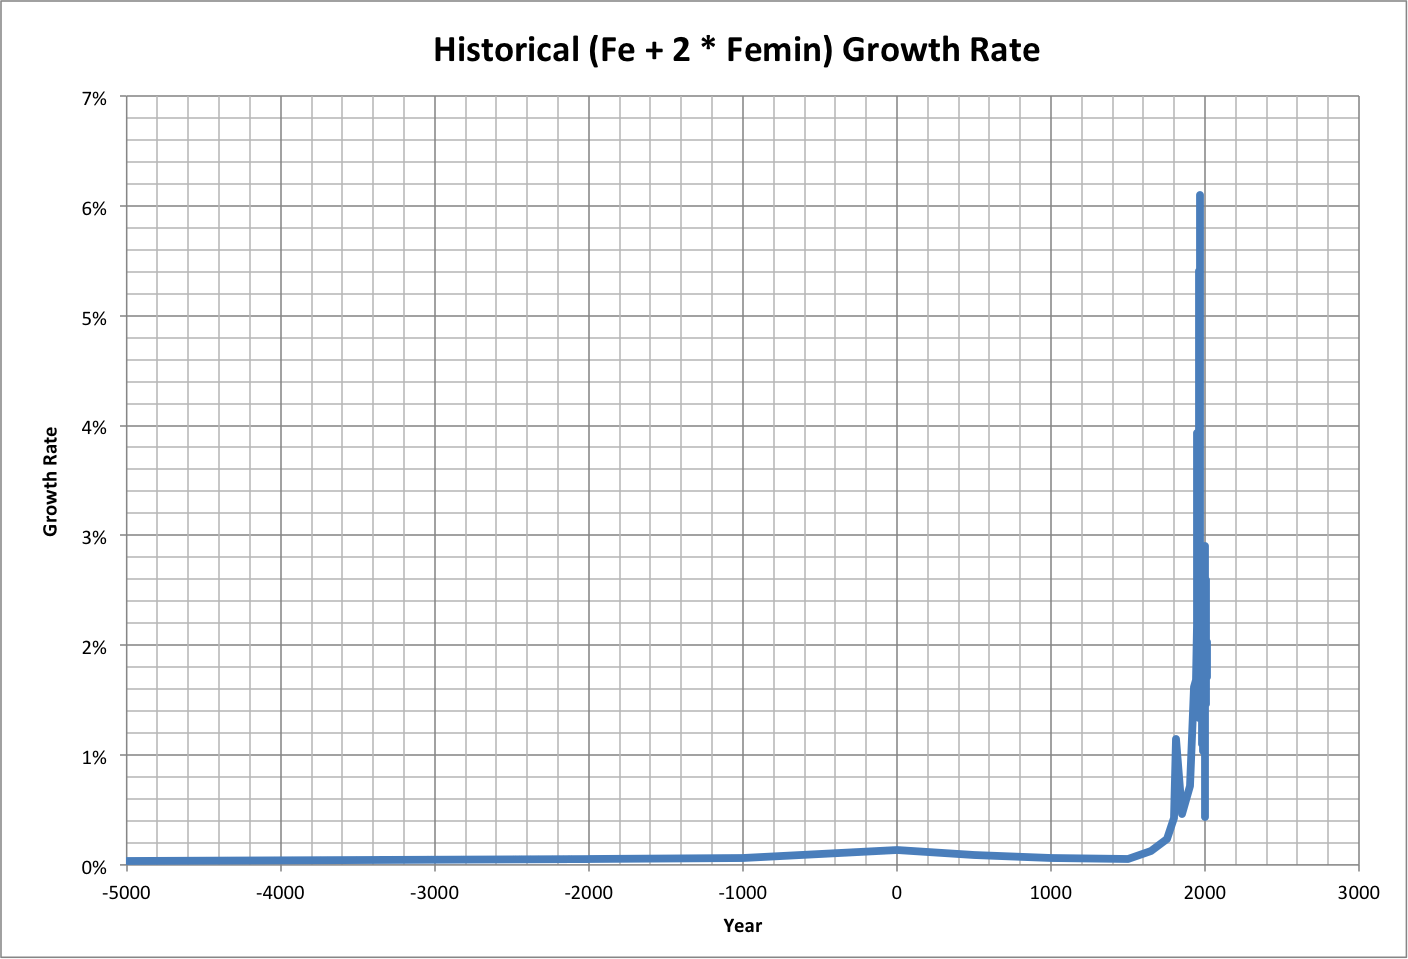
Calculations of historical growth rate are shown below (roll over image for close-up), followed by the projected time when longevity equals zero:
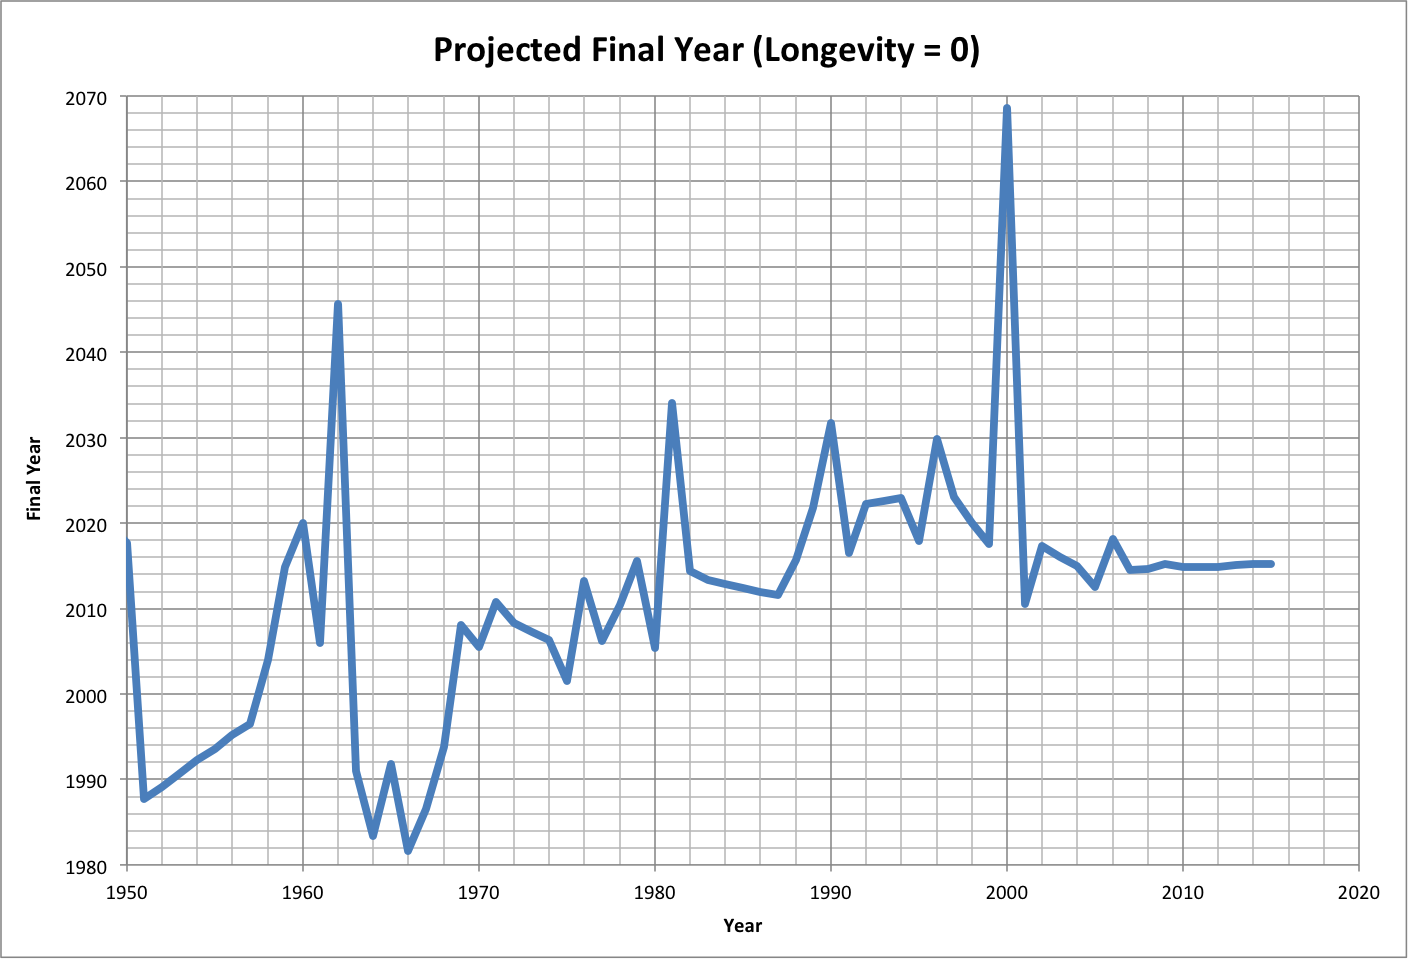
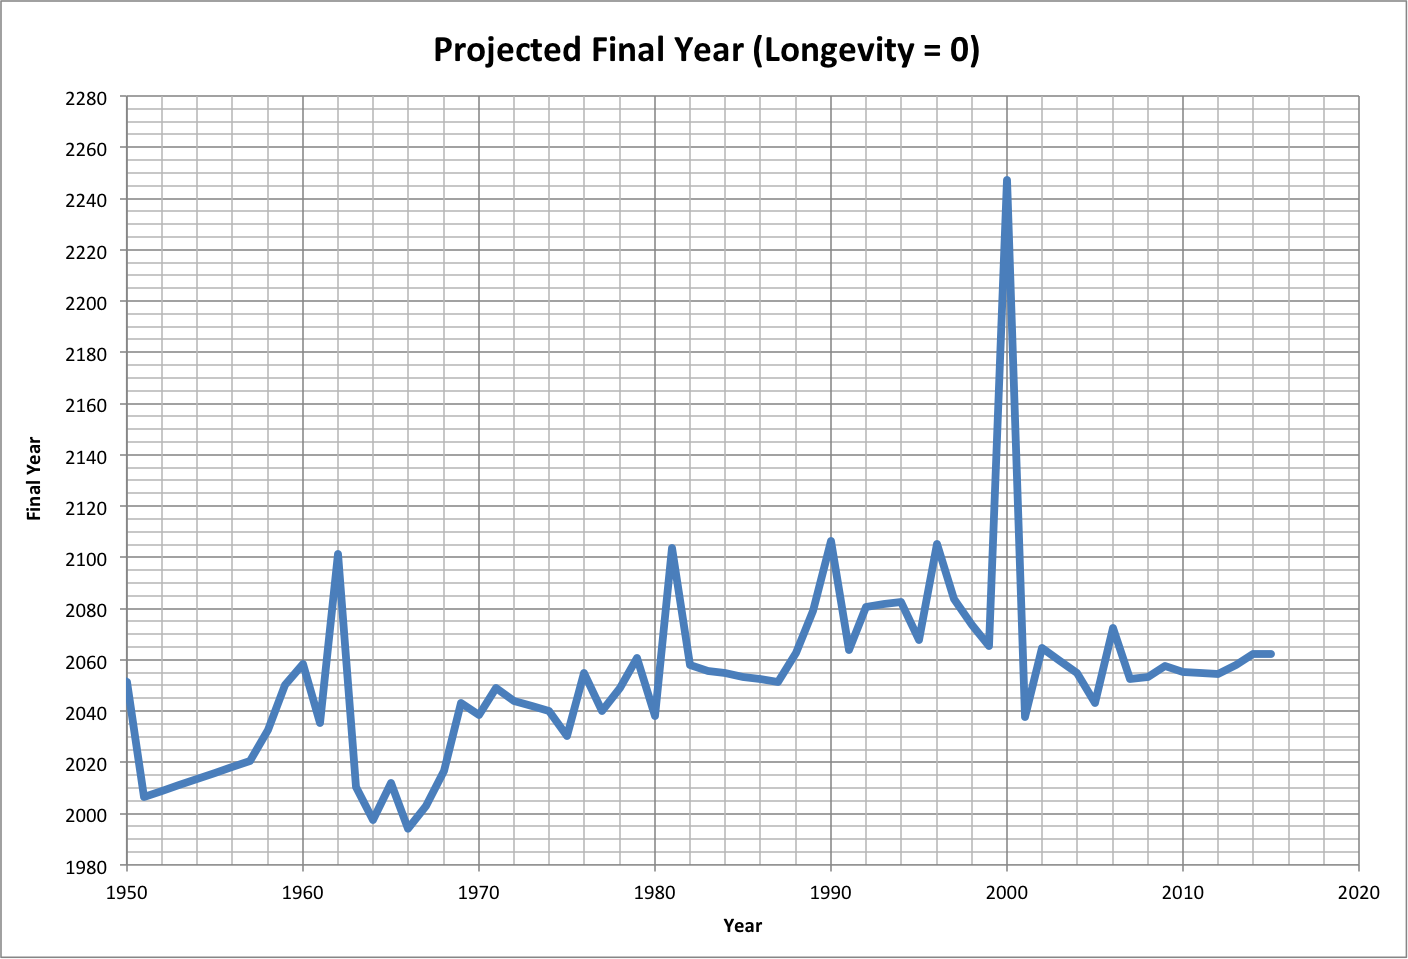
The following graph shows the projected final year if the total resources are twice what is expected. Roll over the image to see the associated growth rates.
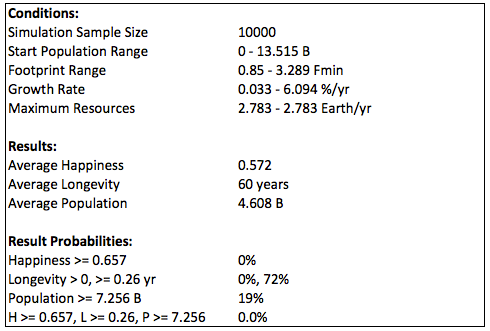
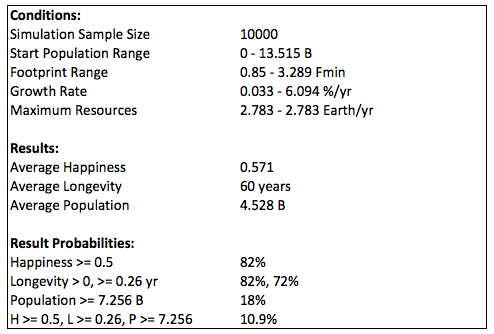
The following summaries show the probabilities for growth as the percent of total options with longevity of at least 0.01 year. In the first summary, the maximum resources are what is expected, and the last line shows the probability of all three constraints (minimum happiness, longevity, and population, corresponding to average values in 2015). That probability is zero (less than 1/10000) due to the happiness constraint.
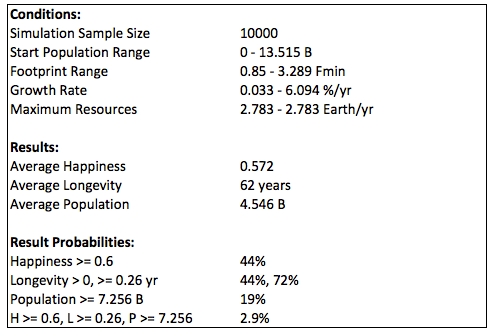
If the minimum happiness is reduced to 0.6, nearly 3% of the options meet the constraints; and if it is reduced further to 0.5, then about 11% of the options meet the constraints:
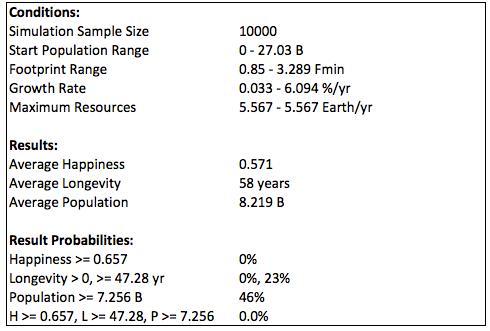
Doubling the resources also results in no options for growth from 2015 due to happiness being too high:
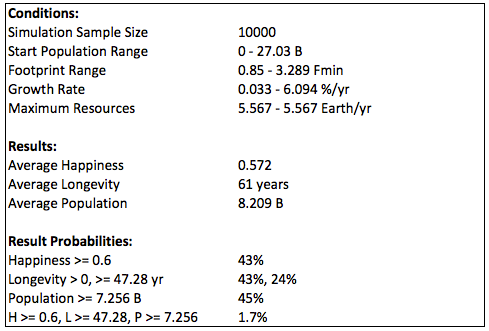
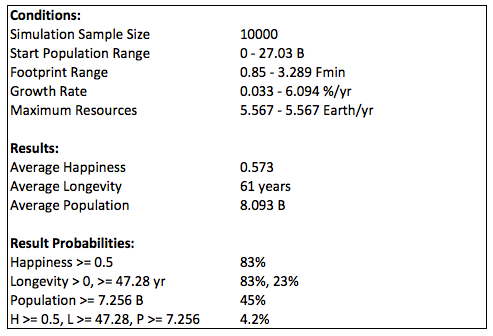
Reducing the happiness constraint also increases the options, but not as much as with the expected amount of resources:
Global warming after 30 years could decrease the total resources from the epected value, resulting in only 3% (down from 11%) of options available for a minimum happiness of 0.5. The historical graph (black) assumes that there are no changes in other variables over that time.
The fraction of total options remaining (OptionFraction) varies linearly with the fraction of total resources needed for consumption, producers, and providers (C):
C = ( Fe + 2 * FeMin ) / FeTotal, with variables defined in Limits
OptionFraction = 0.73 * ( 1 - C )
This translates into the following historical data (based on 20000 simulated options). Roll over the image for a close-up.
.png)
For related information and discussion, see:
- Interacting Groups
- "Assessments" (discussion of this data)
- "Two Stories" (background)
- Future Cases (projections and analysis)