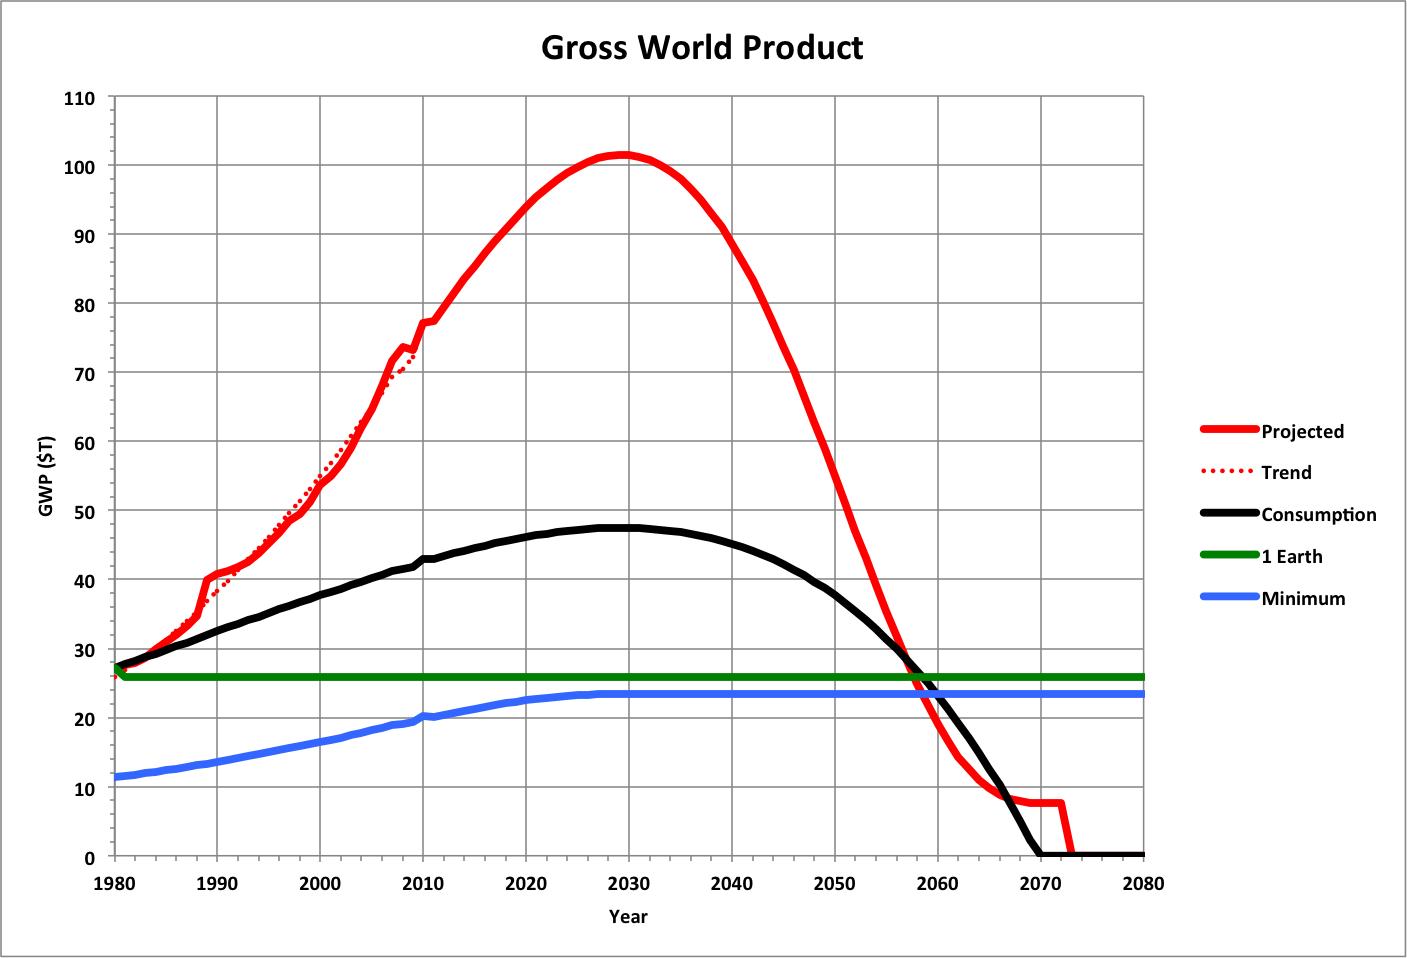
The red line represents total global economic activity as the Gross World Product (GWP) in 2009 dollars, historically to 2009, and projected into the future. The black line is what GWP would be if it were limited to the ecological resources we consume. The green line shows what it would have been if the economy had stopped growing when the world was consuming all of the annual production of ecological resources. The blue line is what GWP would be if we had kept economic activity at the minimum level necessary for everyone to live in a healthy, sustainable society and population grew the same amount. As a general trend (shown as the dotted red line), the world economy has been slowing down since 1990, and will likely continue to do so.
This diagram illustrates both the peril of continuing on our present course and the difficulty of creating a sustainable world. For the latter, we would today have to effectively declare that more than $34T (the difference between the red line and the black line) cannot be used for processing real goods, and an additional $17T to $23T must be cut from the remainder (the difference between the black line and the green line, and the difference between the black line and the blue line, respectively). Instead of having $77T economy growing to $101T, we need the equivalent of a constant $20T to $26T economy.