Consumption Per Person and Happiness |
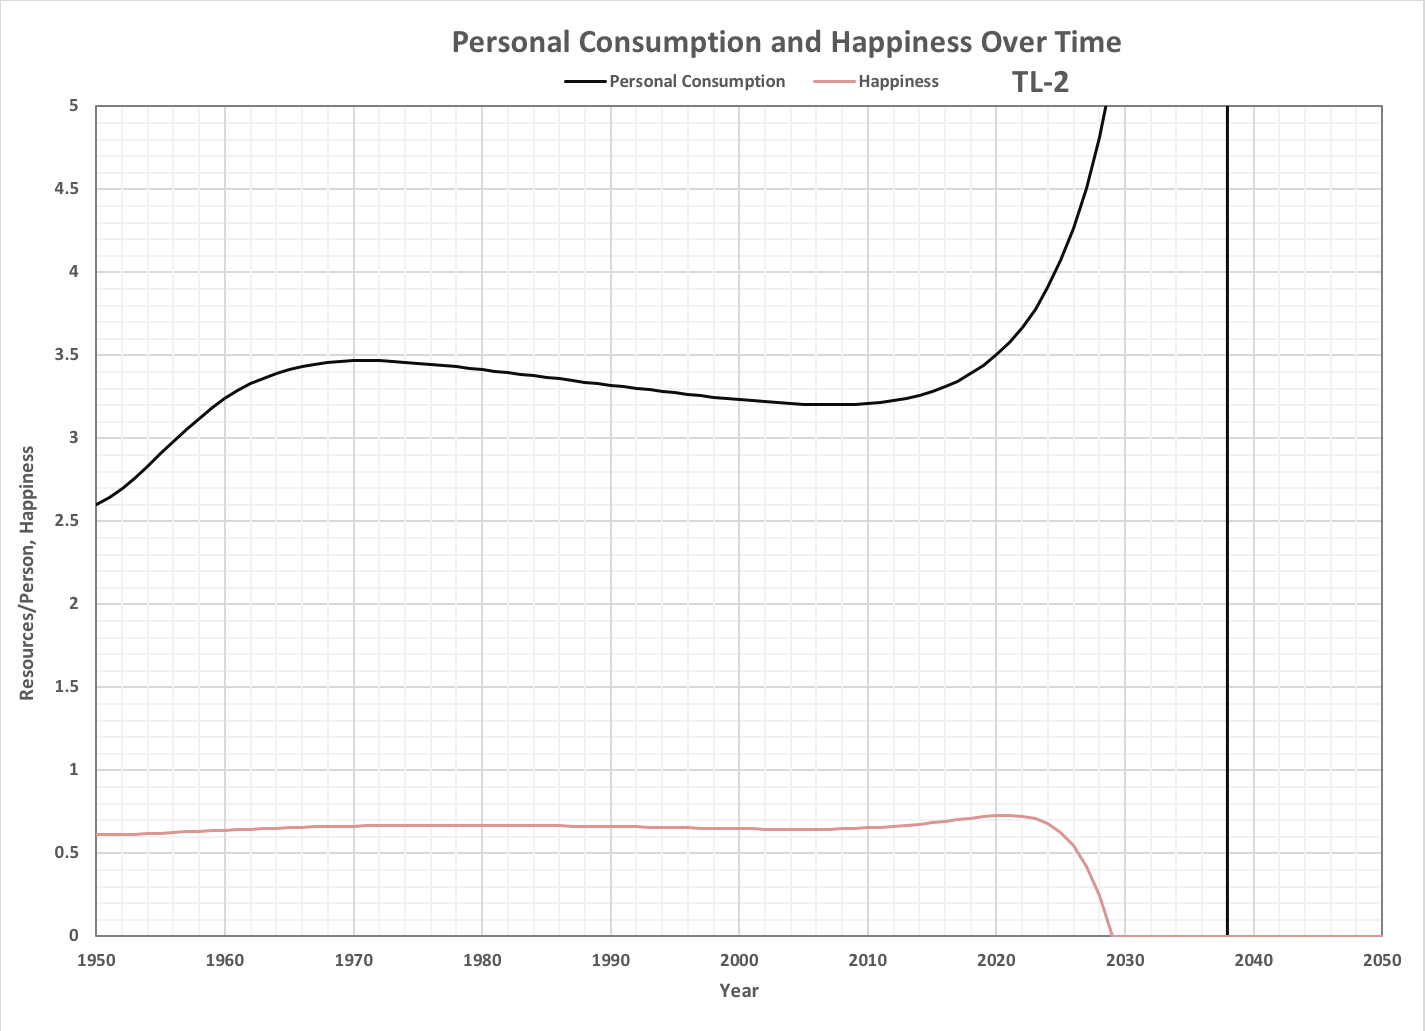
| Personal consumption (resources per person) and happiness vary over time as shown below for Timeline 2. Roll over the image to see all values of personal consumption. |
 |
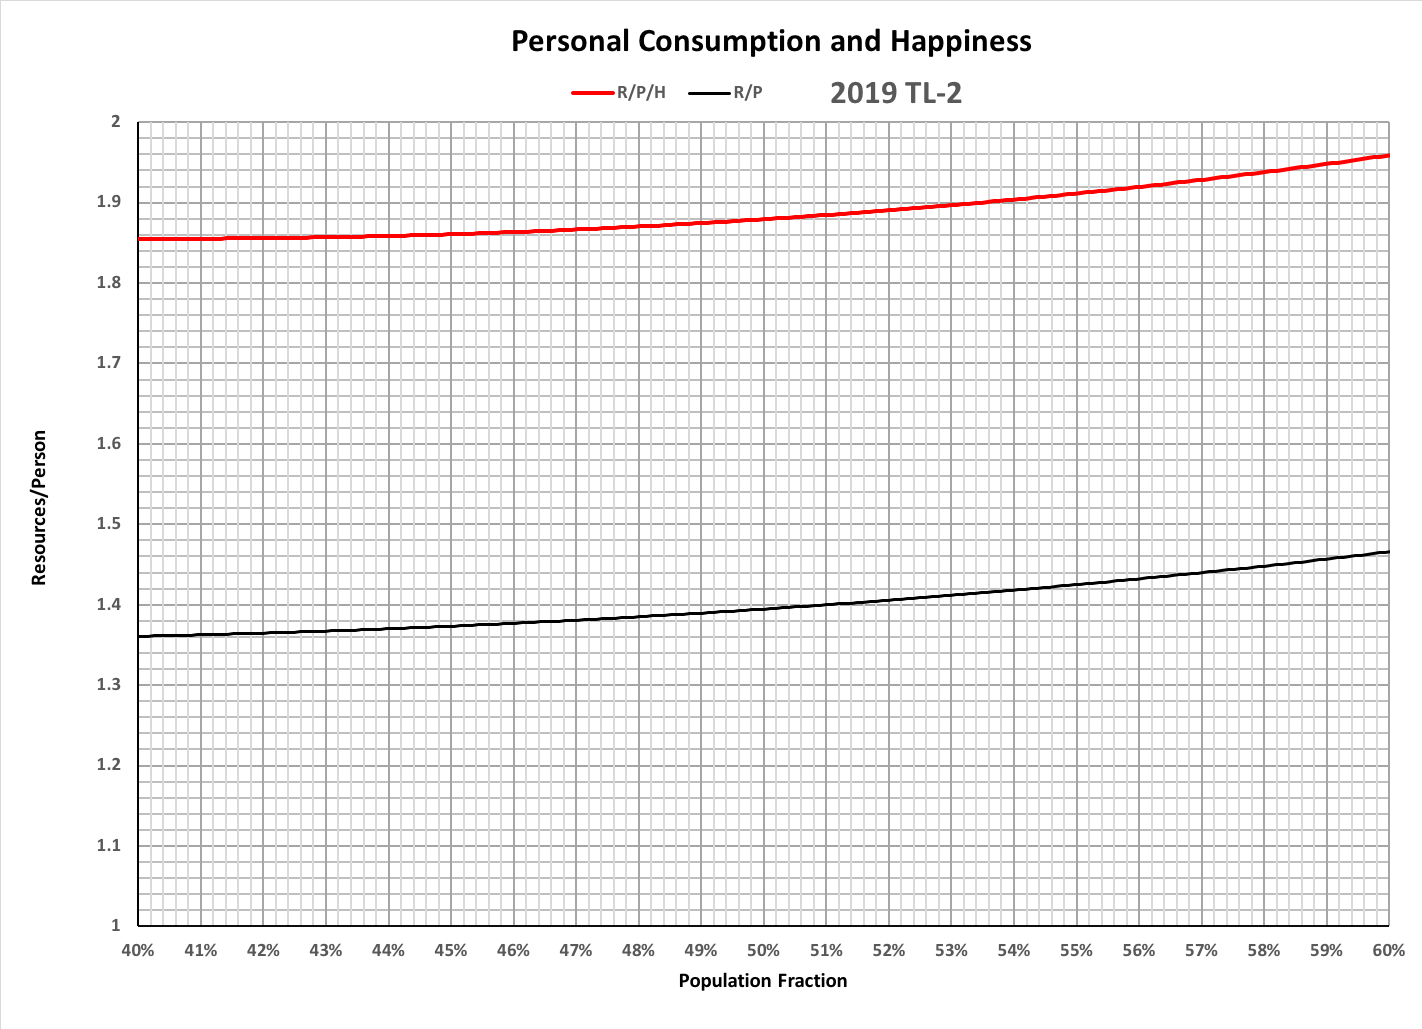
| The amount of personal consumption required to achieve total happiness (at H = 1) varies with basic personal consumption and how much total resources are being consumed by the population as it translates into the species ratio (Sratio). That amount, which is the ratio of personal consumption to happiness (R/P/H), is graphed below along with personal consumption as a function of the population fraction for Timeline 0 where sufficient data is available, and Timeline 2 where it is not available. |
 |
| The most efficient personal consumption is achieved when R/P/H is closest to R/P for the average person (Population Fraction = 50%). This occurs in 2019 for Timeline 2 as shown below. |
 |
| For variable definitions, see Relationships. |
| |
| © Copyright 2018 Bradley Jarvis. All rights reserved. |