Relationships
This page briefly describes the basis of analysis and projections used in timelines.
In general, human history is determined by relationships between humanity and the rest of Nature.
- People treat other species and what they produce as "resources" to be used and then discarded ("consumed"). For convenience, consumption is evaluated on an annual basis.
- Each person in the population consumes a minimum range of resources ("needs") to ensure basic survival. This is mostly comprised of food.
- Additional and easily acquired resources are used by people to provide a basic level of comfort and security ("wants"), which is typically most accessible to the oldest half of the population. This is roughly 6% of the total of both needs and wants.
- Resources consumed for purposes other than needs and wants require the use of even more resources to acquire, and are thus considered "waste."
- What remains of the limited amount of resources that can be consumed each year is "nature," which includes members of other species and what they produce.
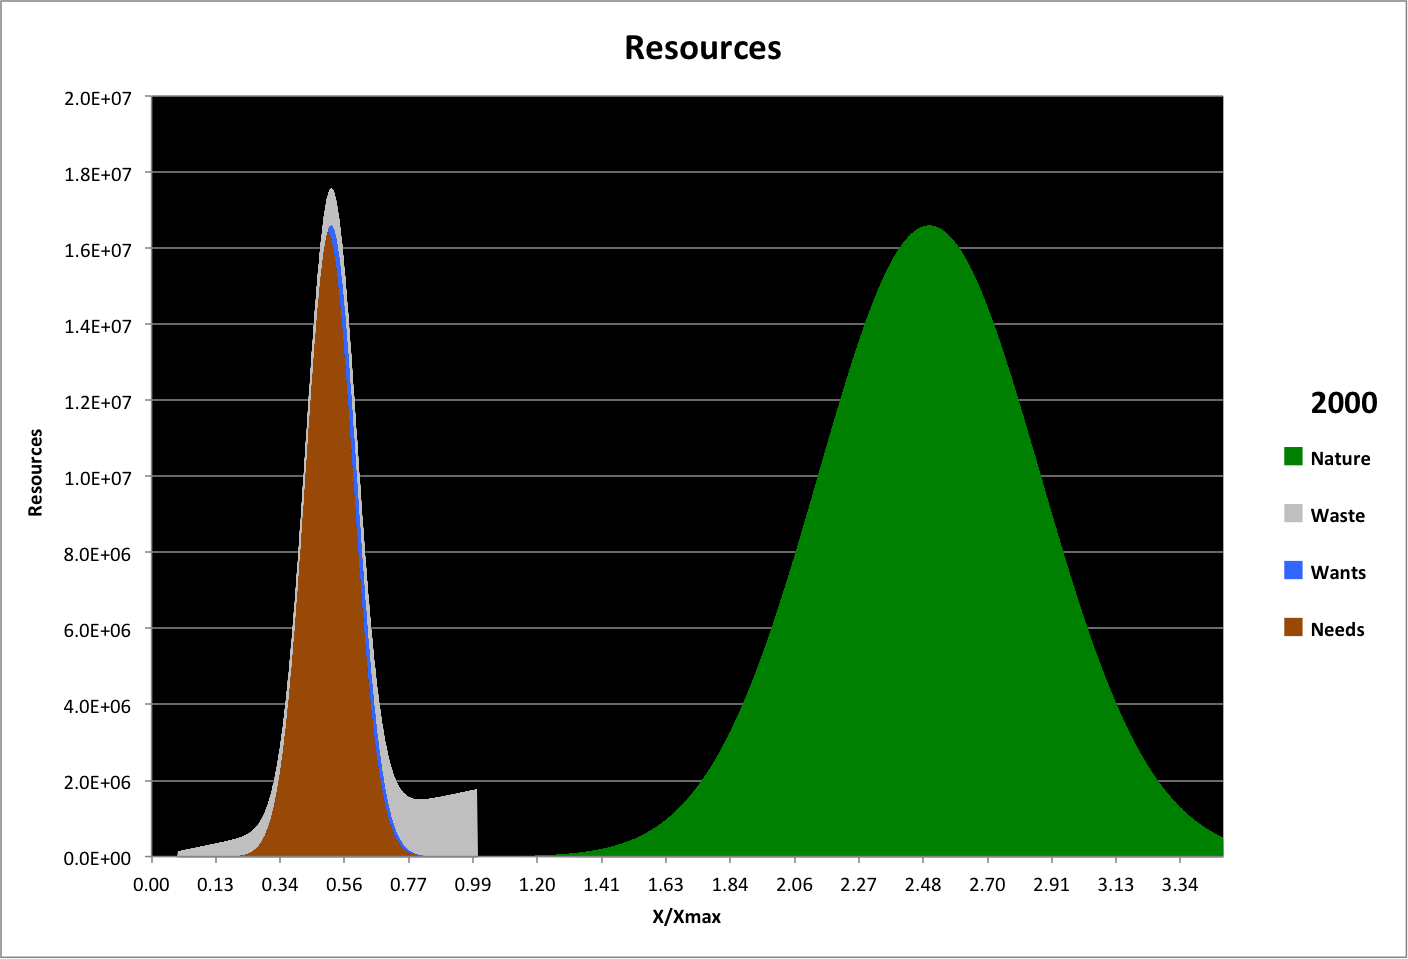
The following graph shows the simulated distribution of resources for the years 2000 and 2018 (roll over to view).
- X/Xmax (also referred to as the "X fraction" Xfrac) is the range of needs and wants for each member of the population, and resources are measured in terms of a standard unit: the minimum ecological footprint f used to calculate happiness h using the relationship h = f / (1.22 * f + 1).
- Using a standard unit allows both populations (human and other species) to be set equal to each other. They are each assumed to be normally distributed around their average resources per individual, with an equal number of standard deviations between their averages and zero calibrated to best match global variable values.
- Waste is the difference between total ecological footprint and the sum of needs and wants, distributed over the population roughly in proportion to X/Xmax.
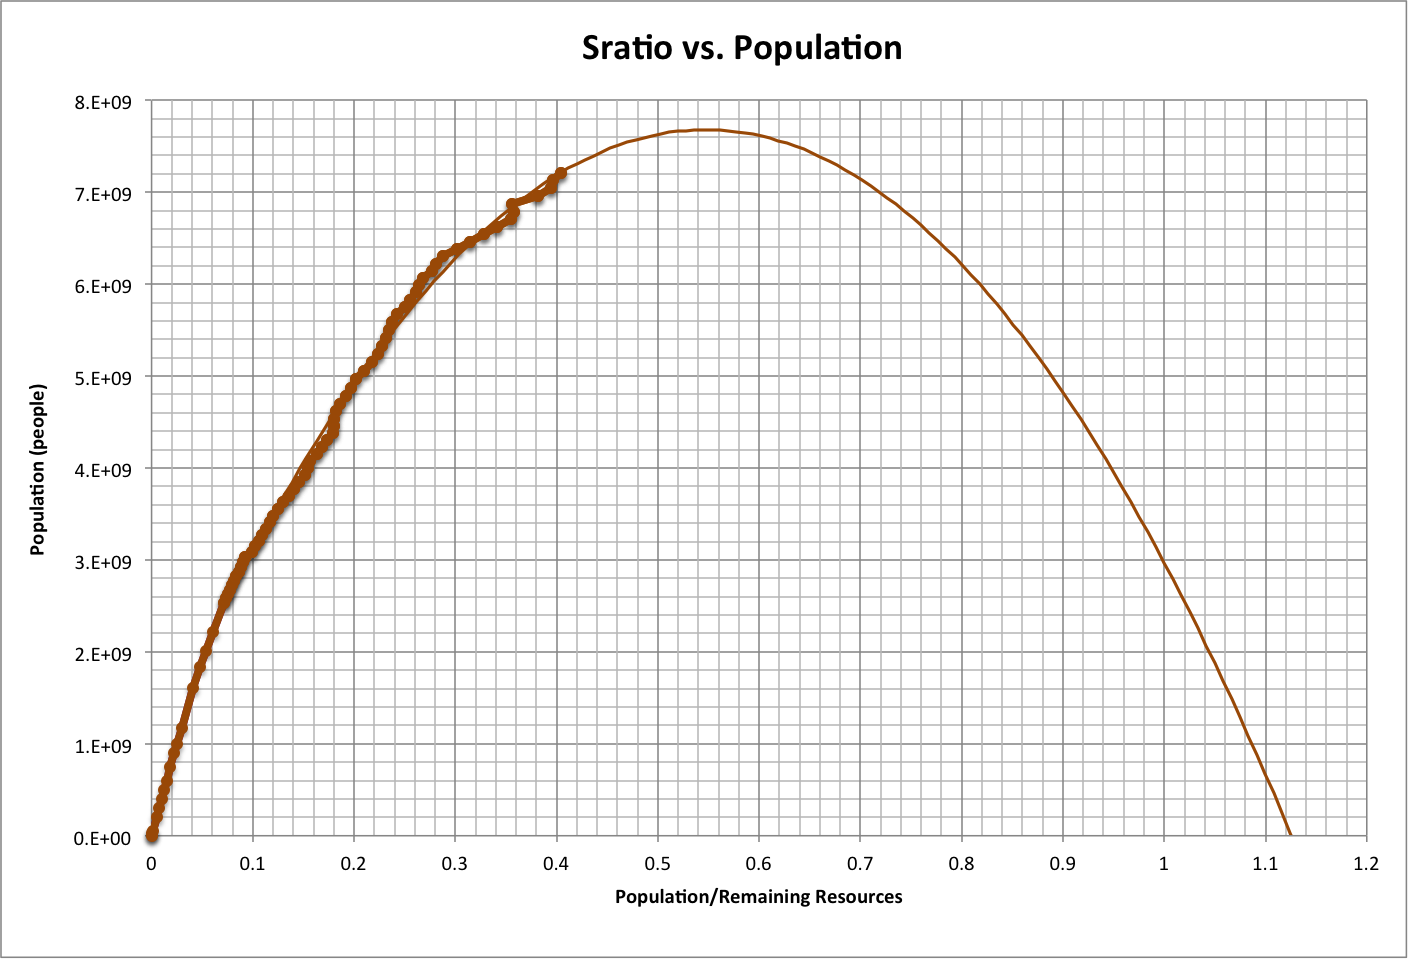
A key variable in the model is the species ratio, or Sratio, which is the fraction of unused resources (nature) required to maintain human survival (1 unit of resources, f = 1, per person in the population). The name derives from the observation that the populations of other species decrease as humanity's total ecological footprint increases.
Sratio has changed over history as shown below (dots), and is projected in the past and future (see the line). Roll over the image to see a closeup of the recent past and near future.
.png)
Population varies with Sratio as shown below, again with dots representing historical data and a line corresponding to a projection. This appears to demonstrate that we humans each need the equivalent of at least about two members of other species to provide what we consume to survive. If so, then fewer humans can survive as those other species are consumed.
Life expectancy, the number of years a newborn can expect to survive, also varies with Sratio. The projection of historical data shown below indicates that it may be governed by a biological "brake" tied to other species that support survival, either directly or pre-emptively.
.png)
.png)
.png)
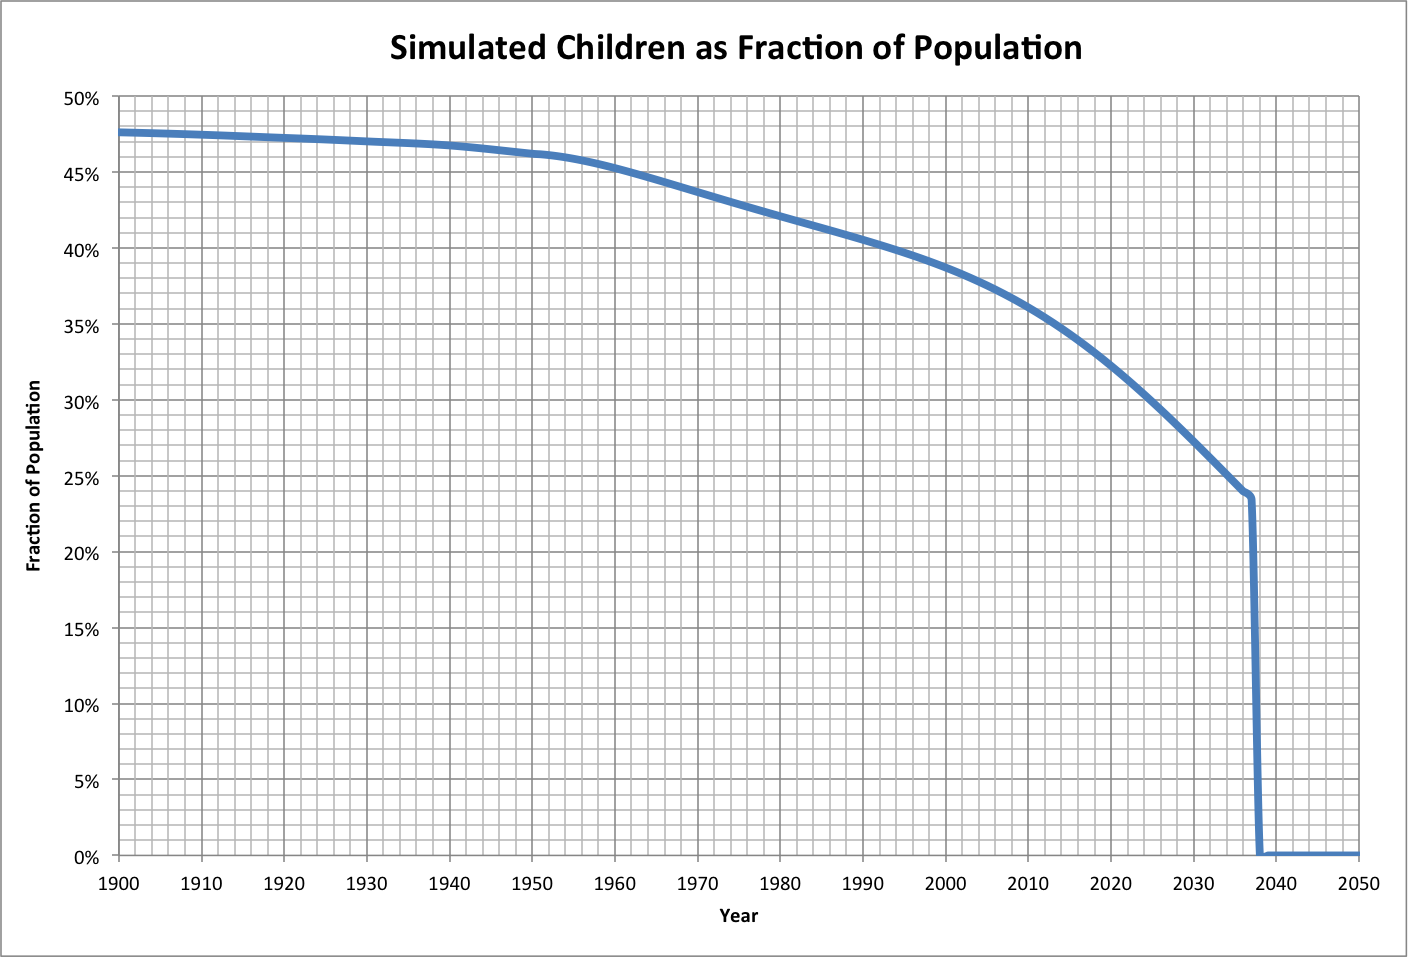
The fraction of the population (Afrac) within a given age range Alow and Ahigh is related to Amed as follows:
Afrac = ( Ahigh - Alow) / (2 * Amed)
For example, the fraction of the population that are children, aged 0-20 years, is graphed below for the period 1900-2050. Note that the maximum (before 5000 B.C.E.) was 50%, and that in 2018 the fraction is projected to be 33%.
_TL-2.png)
.png)
.png)
.png)
See also: