Backcast
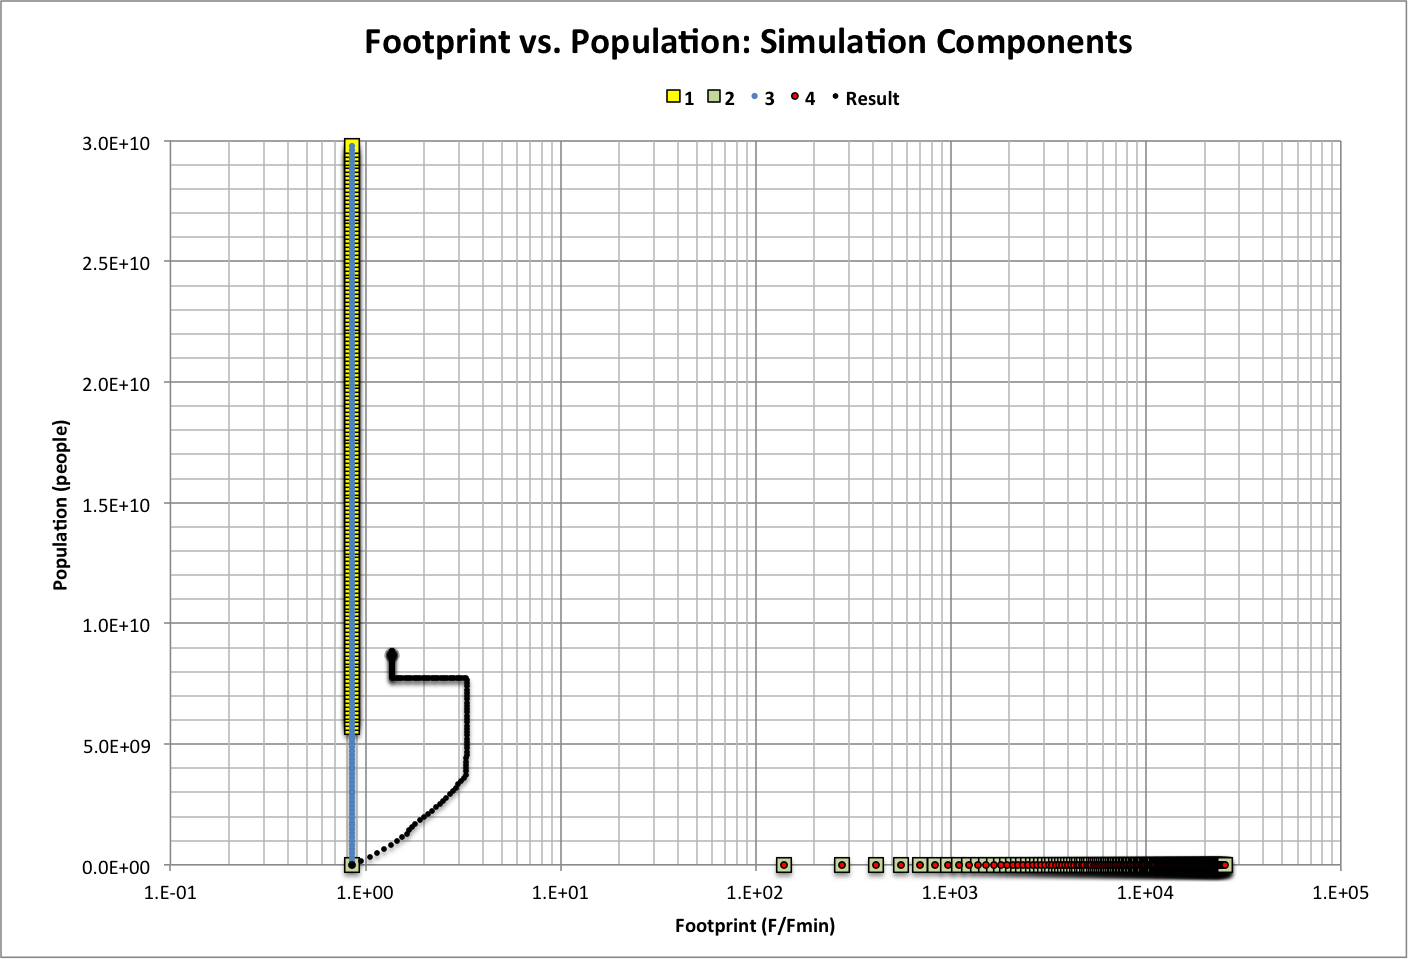
Here, F is the average per-capita ecological footprint in Earths/person/year and Fmin is the minimum ecological footprint. Points on the graph represent a value of global footprint (Fe = P * F, where P is population), separated in each simulation by a difference of 0.01 Earths/year. Simulations and the result all start at year 10000 B.C.E., when P = 1E+06 people and f0 = F0 / Fmin = 8.5E-01.
The simulations are calculated as follows:
| Simulation 1 | f1 = f0 P1 = Fe / (f1 * Fmin) Maximum Limits:
|
||||||
| Simulation 2 | f2 = (Fe / P2) / Fmin P2 = P0 Maximum Limits:
|
||||||
| Simulation 3 | f3 = f0 P3 = Fe / (f3 * Fmin) Maximum Limits:
|
||||||
| Simulation 4 | f4 = (Fe / P2) / Fmin P4 = P0 Maximum Limits:
|
The result is calculated using two equations:
Presult = (a1 * P1 + a2 * P2 + a3 * P3 + a4 * P4) * (fresult > 1)
+ (a1 * P1 + a2 * P2 + a3 * P3 + a4 * P4) * fresult * (fresult <= 1)
fresult = a1 * f1 + a2 * f2 + a3 * f3 + a4 * f4
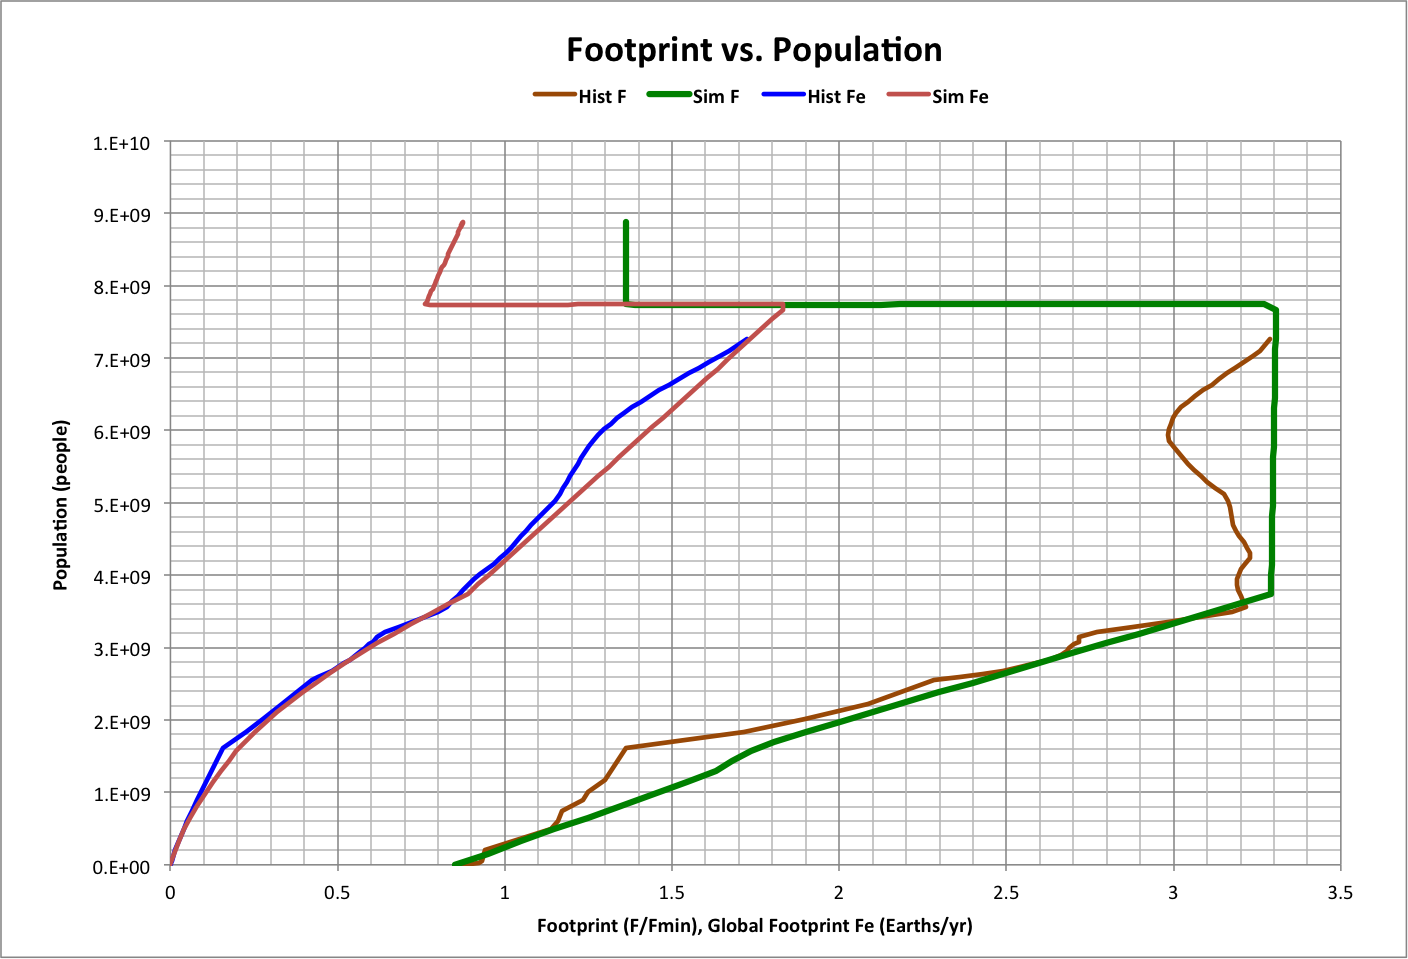
The weights ( an ) and maximum global footprints (Felow and Fehigh) are chosen to best fit the result to historical data:
a1 = 1.66546947E-01
a2 = 7.14486E-04
a3 = 8.32734736E-01
a4 = 3.83058E-06
Felow = 2.6E-01
Fehigh = 2.972069653
The resulting values of f , P, and Fe are shown below along with historical data:
Time tn - tn-1 in years between two values of Fe can be estimated using the following relationships:
tn - tn-1 = (Feration - Feration-1) / (0.01 * Fen)
Feratio = Fe / Fehigh
The validity of this estimate can be seen in the following graph of population (normalized to the value in 2015, the last historical value). Roll over the image to see the entire history.
_close.png)
Normalizing global variables, the future is projected as follows:

See also:
- Version 2
- Discussion: A Brief History of Civilization