Approximations
| Population Growth Rate | Prate = 2.5% /year |
| Footprint Growth Rate | Frate = 0.5% /year |
| Total Resources | Femax = 3 Earths/year |
| Minimum Footprint | Fmin = 7-12 = 1 / (712) Earth/year/person |
| Minimum Population (with Minimum Footprint) | Pmin = 2E+07 = 20 million people |
| Resource Generators | a = 2 |
| Footprint | f = F / Fmin |
| Footprint at time t (starting from f = 1 at t = 0) | fsim = (1 + Frate)t |
| Population at time t | Psim = Pmin * (1 + Prate)t |
| Maximum Population (f = 1) | Pmax = Femax / Fmin = Femax * 712 |
| Peak Population | Ppeak = Pmax / (f + a) |
| Peak Footprint (for population P) | fpeak = Pmax / P - a |
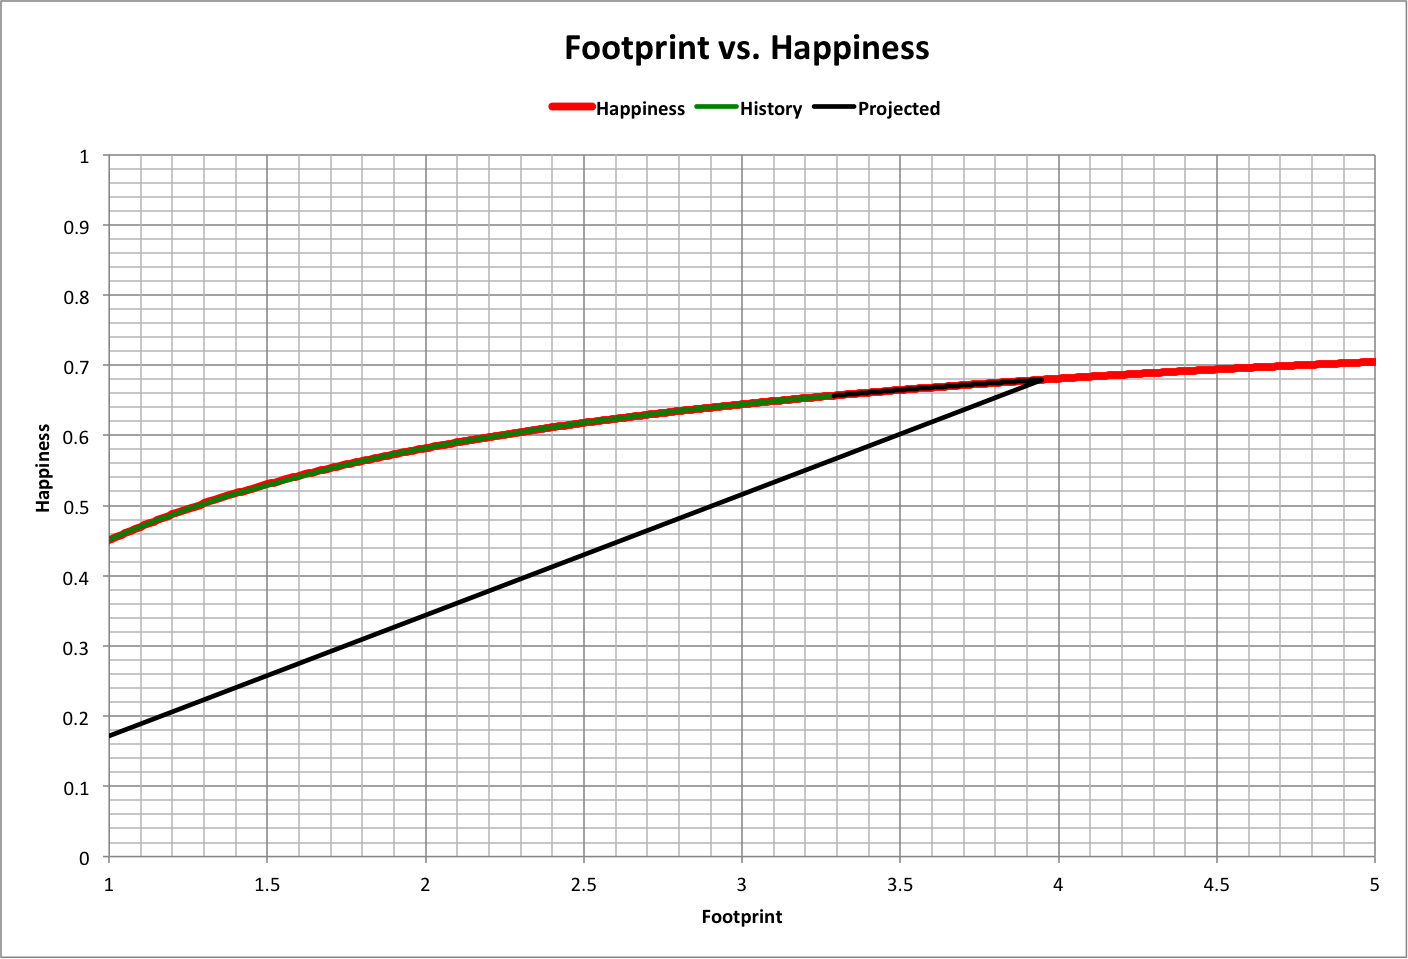
| Happiness | h = f / (1.22 * f + 1) |
| Happy Environments (for population P) | Env = h * P |
| Peak Happy Environments | Envpeak = h * Ppeak |
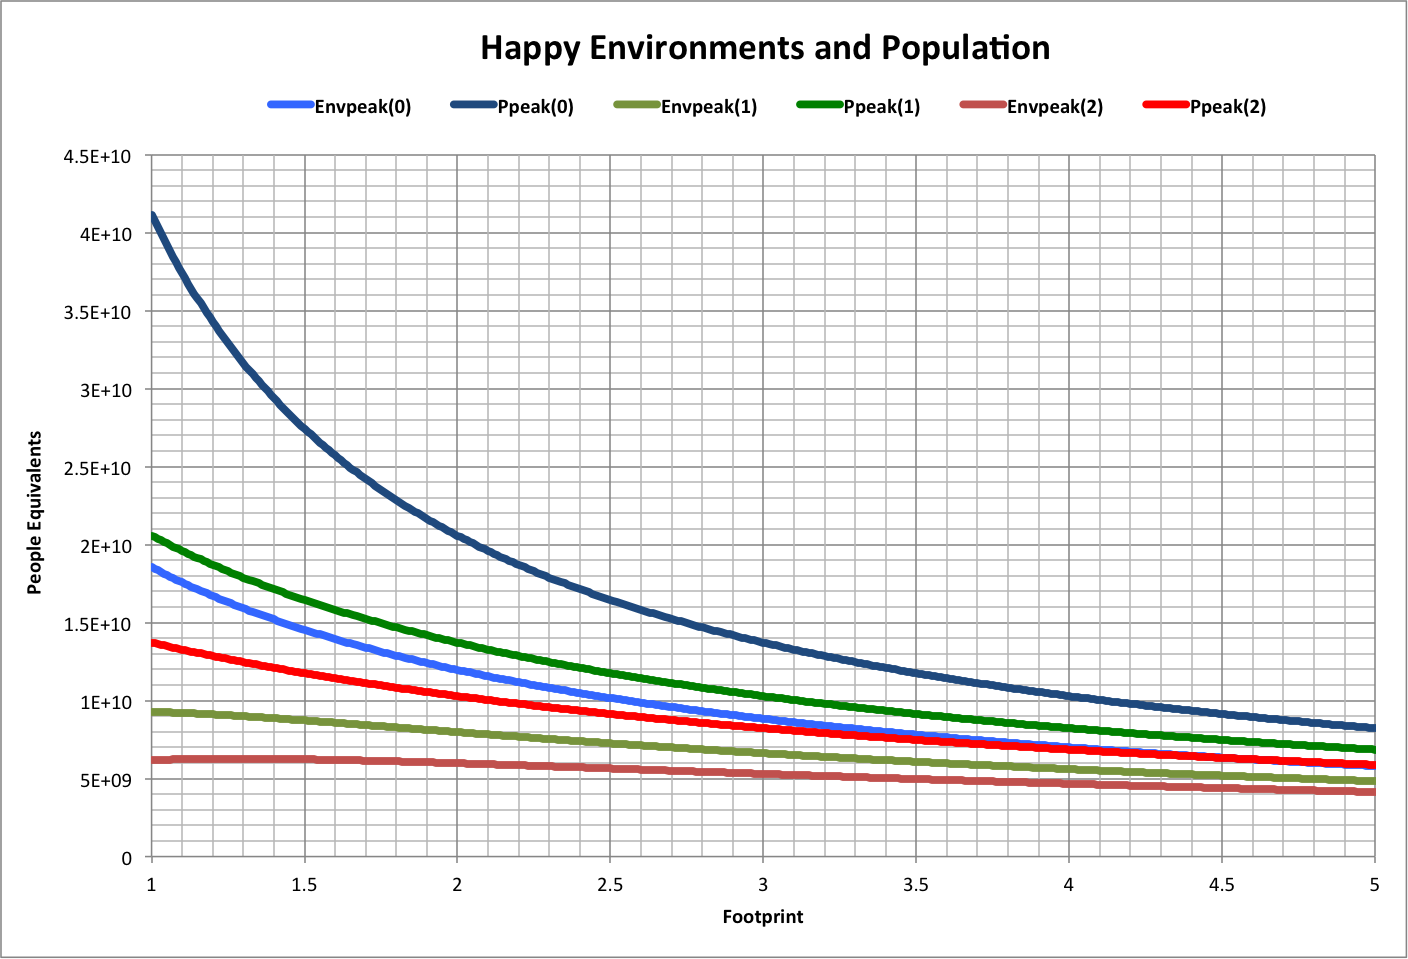
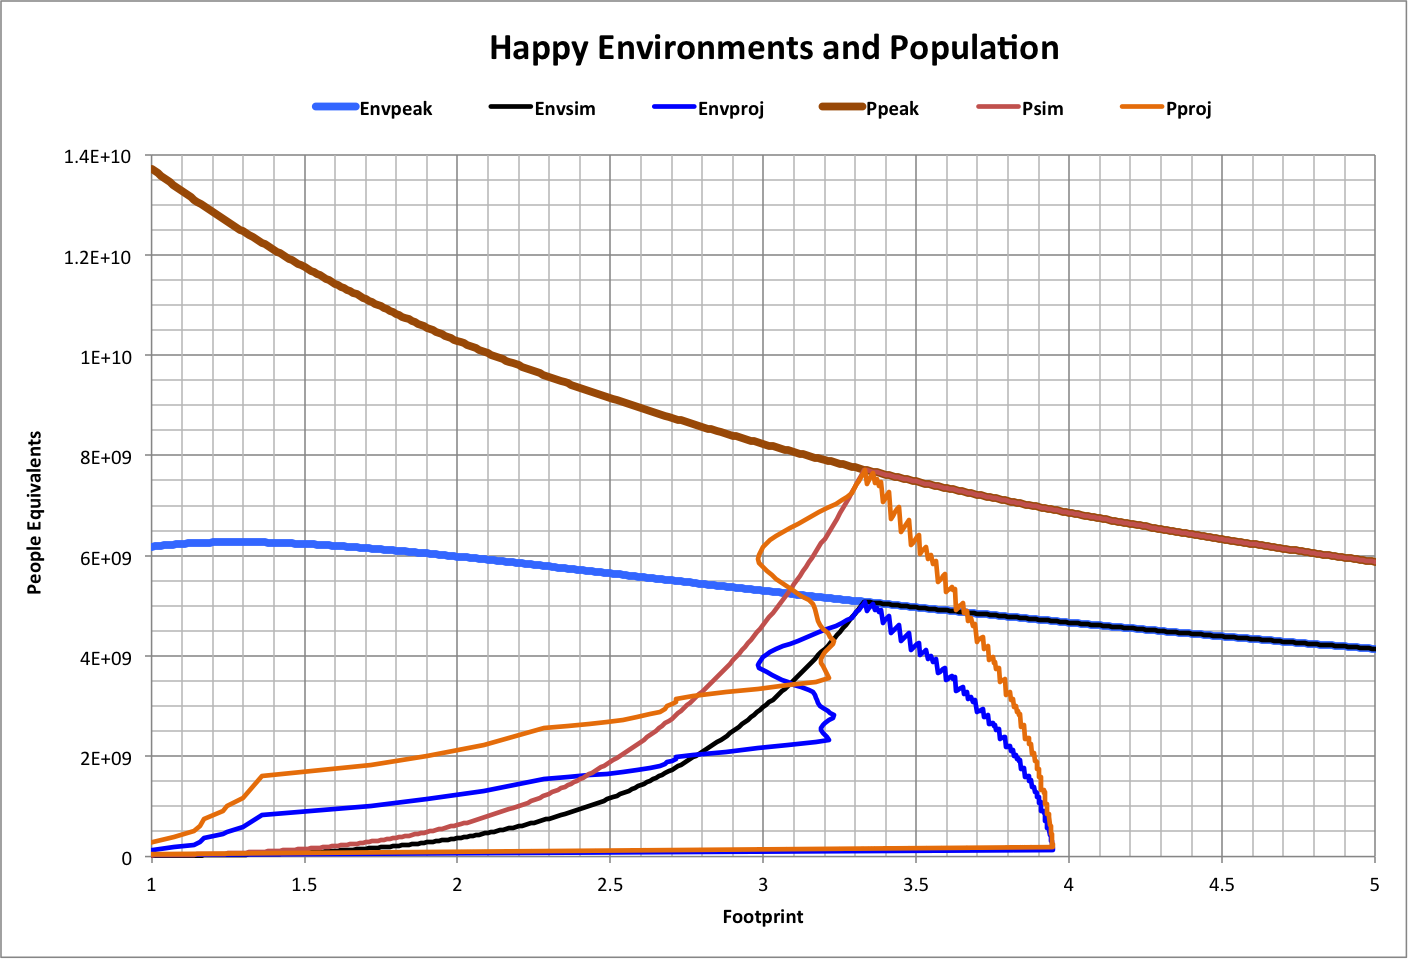
The following graph shows how the peak values of population (Ppeak) and happy environments (Envpeak) change with footprint.
Approximations to historical growth of population (Psim) happy environments (Envsim) are also shown, along with values from the limit-seeking projected case (population Pproj and happy environments Envproj) which include historical data.
See also: