|
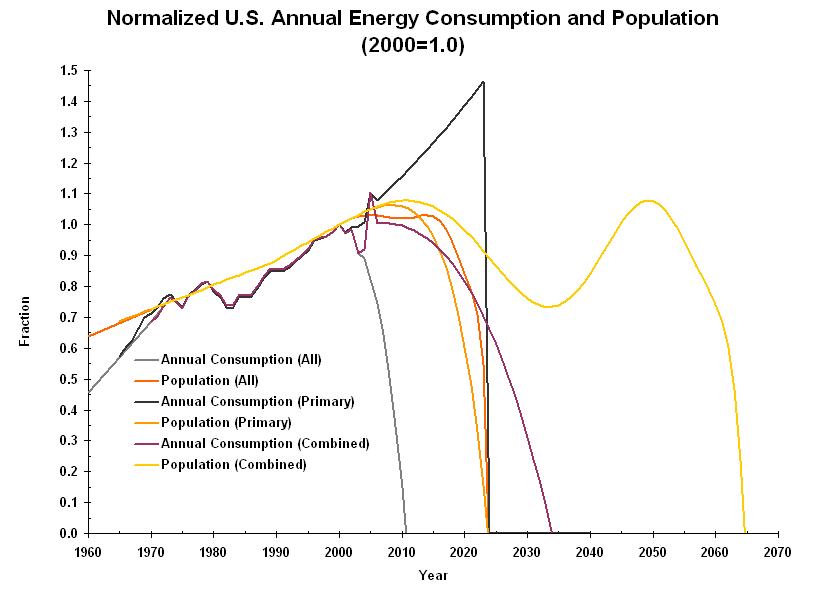
United States Energy Consumption An analysis of the U.S. energy consumption, similar to that of world resource consumption, is summarized in the following graph:
Each pair of projections is based on a specific set of annual consumption data.1
A PERT estimate using Primary as the mode case, with All and Combined as the low and high cases, yields the following graph:
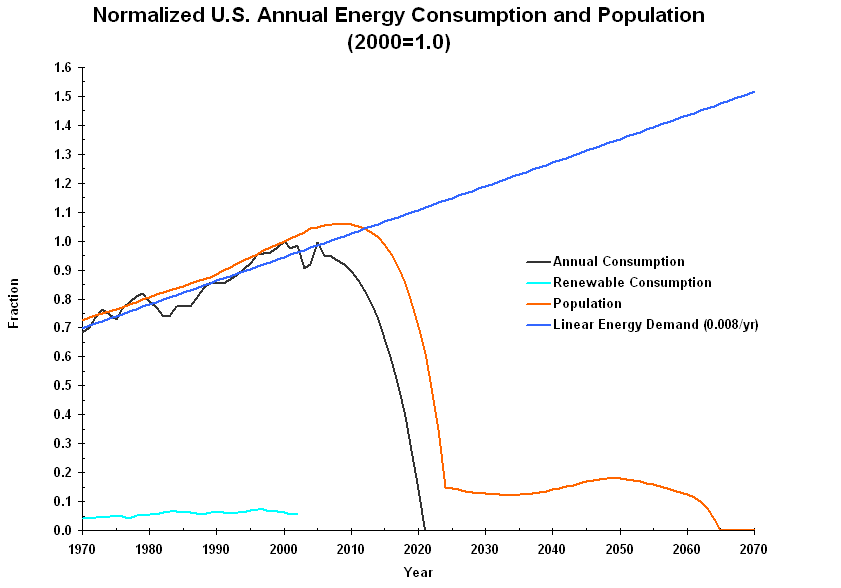
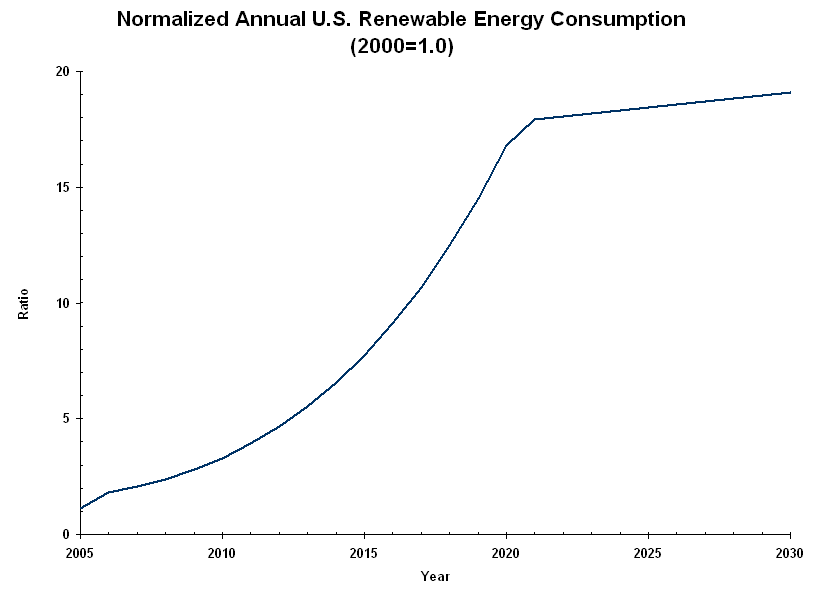
Also shown is a linear curve fit to annual consumption since 1970, which represents a target to be met by alternative energy sources. Renewable energy consumption is presently about 6% of that from all sources, and with considerable effort could meet our needs before it's too late. If we made up the difference between projected consumption and the target by using renewable energy, the fastest change in capacity would need to occur in the first 15 years, as shown below. The problem is not limited to increasing capacity; it also includes adapting our energy infrastructure to distribute the energy efficiently to everyone who wants it, which may be at least as big a task.
When the crisis is over, our next worry will be what to do when the maximum capacity is reached.4 Of course, this assumes that our consumption must continue growing, which is not necessarily a given. At least, because we are using renewable energy, we won't have to worry about the fuel running out.
Notes: 1 Population data from 1960-2003 is total population in Table 2 of Statistical Abstract of the United States 2004-2005 (U.S. Census Bureau, 2004). Data for 2004 is calculated from Time Almanac 2006 (Information Please, 2005), p. 123. 2 Data from Table 884 of Statistical Abstract of the United States 2004-2005. 3 Data from BP Statistical Review of World Energy June 2005 (Beyond Petroleum, 2005). 4 If just the potential electricity generating capacity of the western states were used to meet the shortfall, each 1% of land would be able to contribute 4-12 times the annual consumption of renewable energy in 2000. These numbers are based on data from EnergyAtlas.org, where the high limit assumes that solar efficiency will be multiplied by eight as a result of new solar thermal technology. For more information, see Limits to Consumption. |