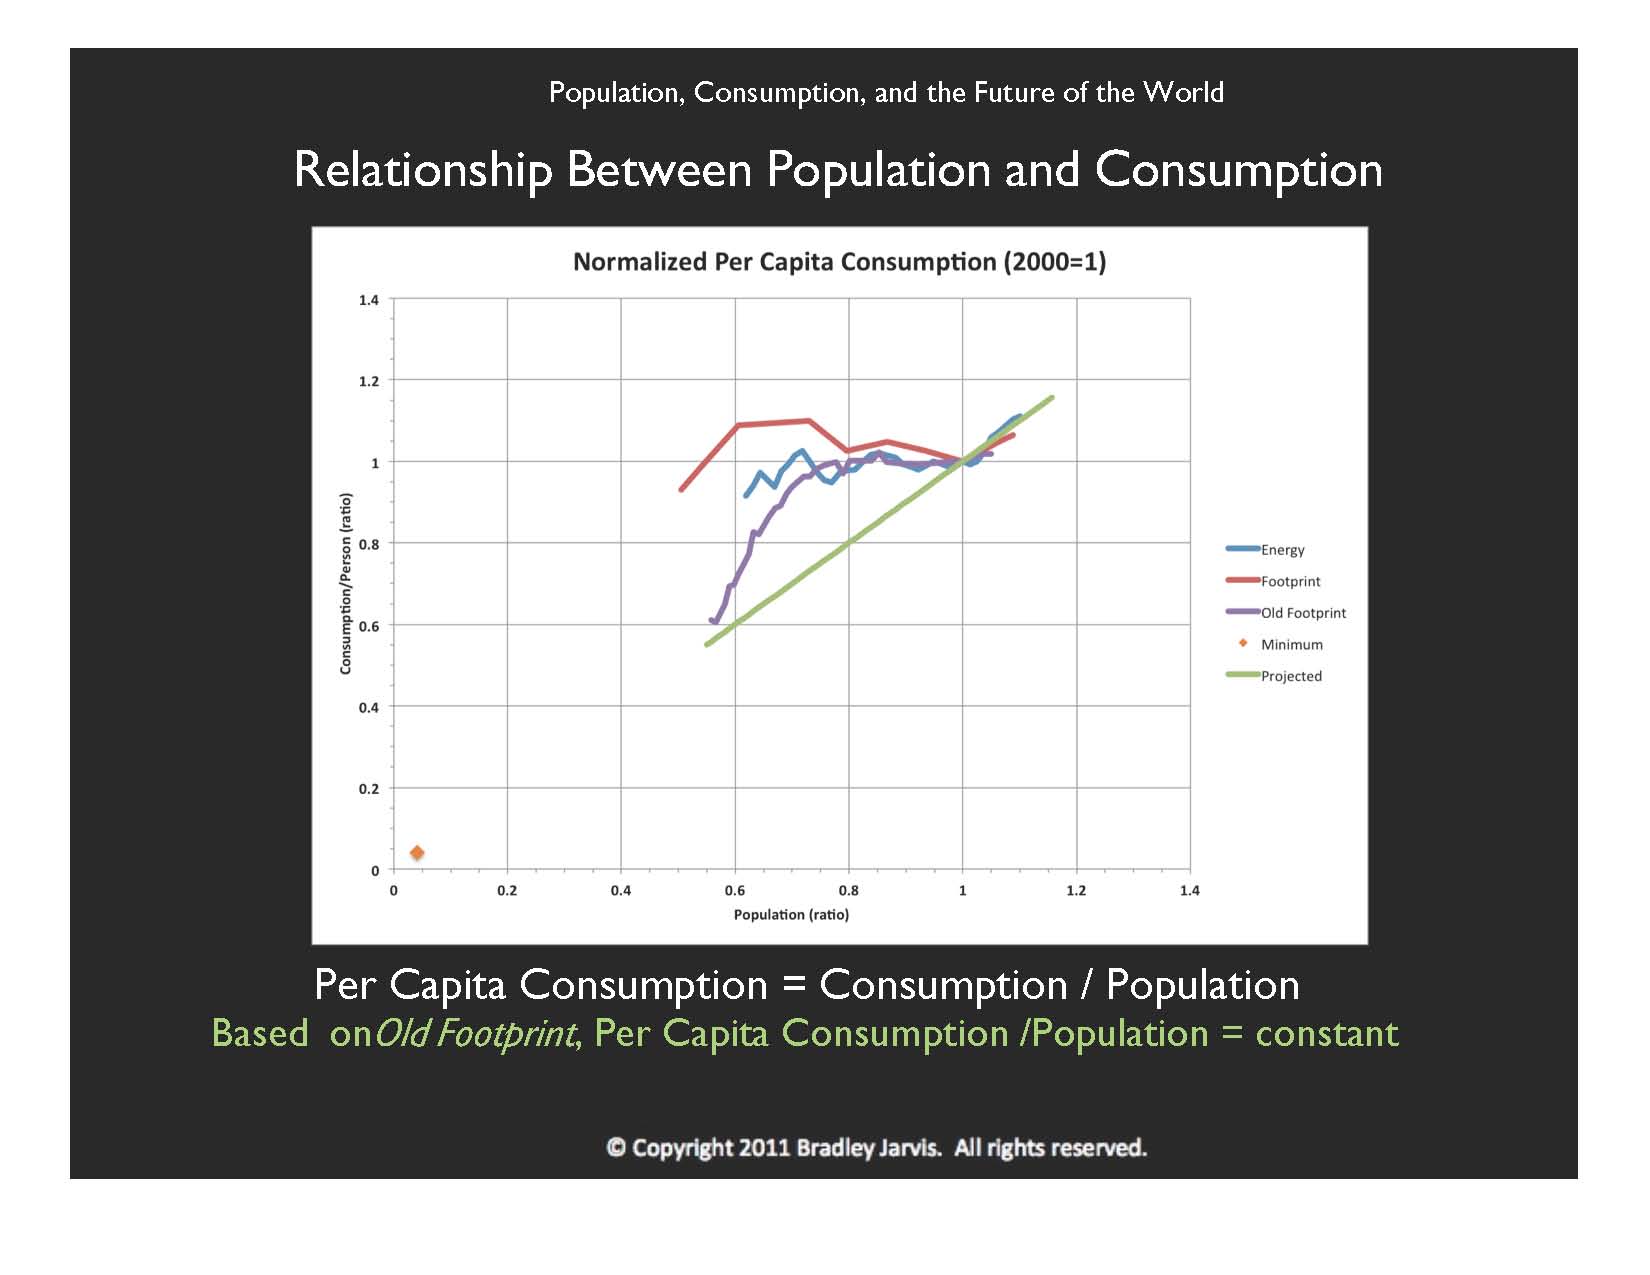
This graph shows how world per capita consumption (the average consumption per person) varies with population, normalized to their values in the year 2000. There are two sets of ecological footprint data: The "Old Footprint" uses the definition of ecological footprint as it existed in 2006, and "Footprint" uses the current definition. "Energy" is world energy consumption. (See my Web site for sources and details.)
Based on the Old Footprint, per capita consumption is proportional to population, as indicated by the straight line. I used this for my projections of population and consumption until very recently. The orange dot near the bottom-left corner shows what I considered to be the minimum footprint.
The current data shows that per capita consumption appears constant, or not dependent on population at all. If we projected Footprint and Energy back toward zero population, we would be led to believe the total nonsense that, before civilization, people consumed as much as we do today.
© Copyright 2011 Bradley Jarvis. All rights reserved.