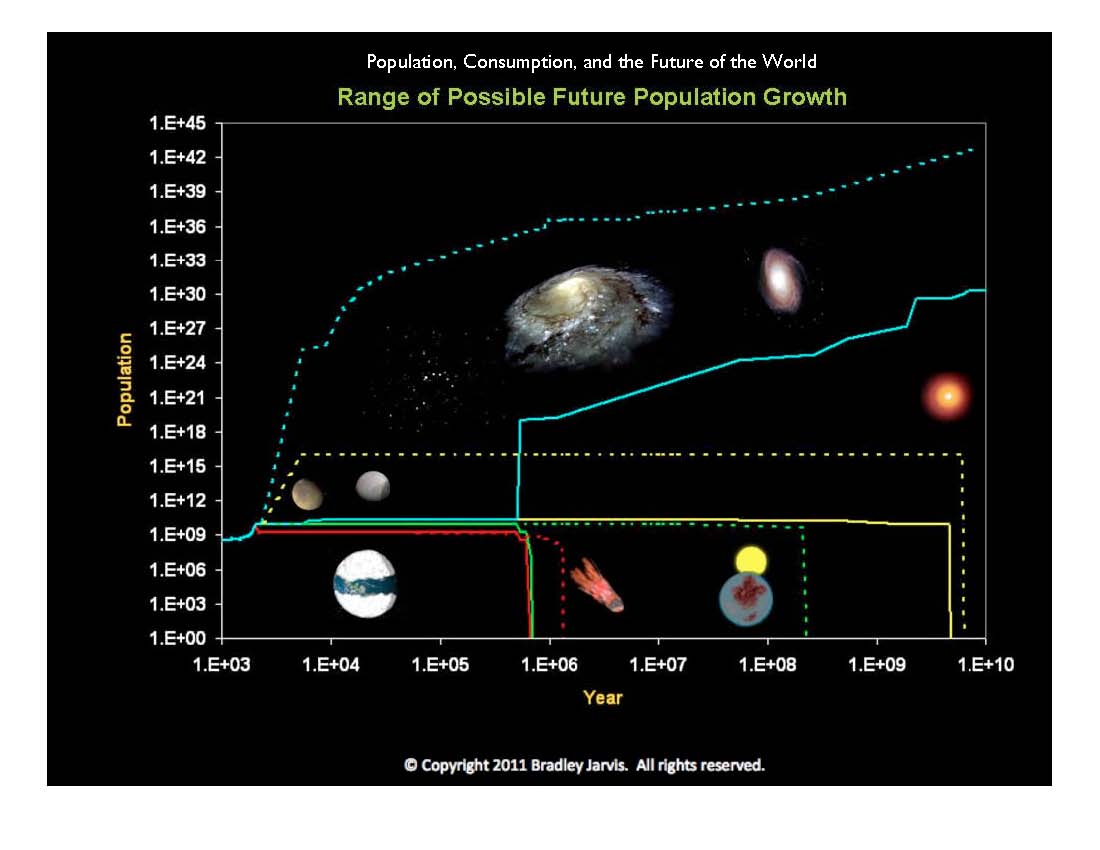
This graph illustrates the humanity's possible future population as I envisioned it in 2005. It comes from a presentation I did about the settlement of space.
Like many of the graphs in this presentation (and on my Web site), it uses scientific notation for numbers. Here, "E" stands for "multiply the previous number by 10 raised to the following exponent." For example, "1.E+04" means "1 x 104" or 10,000.
I became interested in the limits to population growth after hearing a presentation about Peak Oil and the consequences of exponential growth by Professor Al Bartlett at the University of Colorado. At the time, I was already convinced that for life to survive the longest, humans would need to settle space beyond the Solar System. This is because, as the graph illustrates, the time life can survive on Earth (and in its vicinity) is limited by our Sun's eventual demise. I had also studied the potential for our civilization being wiped out by an asteroid or comet impact (also pictured), which had resulted in several presentations to the local astronomy community. The exhaustion of key resources on Earth fascinated me, and I set out to learn if such limits existed for space, where resources are much more abundant.
There is also another feature on this graph which I use a lot of elsewhere: multiple scenarios. There are three scenarios shown, and minimum and maximum trajectories for each.
The red lines illustrate how population might change if we continue on our present course (again, as I envisioned it in 2005). The solid line shows the worst case (population falls to a low level due to exhaustion of resources and then crashes early), and the dotted line shows the best case (the crash occurs later). Both crashes are due to an impact by a large asteroid or comet, with the difference in timing based on the range of probabilities of such an impact.
The green lines demonstrate a "sustainable" population size, where we optimize our use of Earth's naturally renewable resources. Again, the solid line is the worst case and the dotted line is the best case (in terms of population size over time). We might, in the best case, be able to invest some resources in the deflection of comets an asteroids, putting off our death until the land-locking of the continents causes climate change that kills most plants and animals, followed by the ultimate die-off as the carbon cycle stops because the Sun's increased heat burns off most of the atmosphere's carbon dioxide, which plants need to survive. Note that these and other events pictured, such as the coming ice age, are detailed in the excellent book, The Life and Death of Planet Earth.
The yellow lines show best and worst cases for our settling the Solar System. The difference between these two is based on how far we are able to get away from the Sun, which will grow to a red giant, turning Earth into a Venus-like planet.
Finally, the blue lines illustrate how the population might grow if some of us escape the Solar System altogether. The relative positions and motions of stars and galaxies, the likelihood of other solars systems being habitable, and how fast we can reach them affects how many of us there might be over time in this scenario.
© Copyright 2011 Bradley Jarvis. All rights reserved.